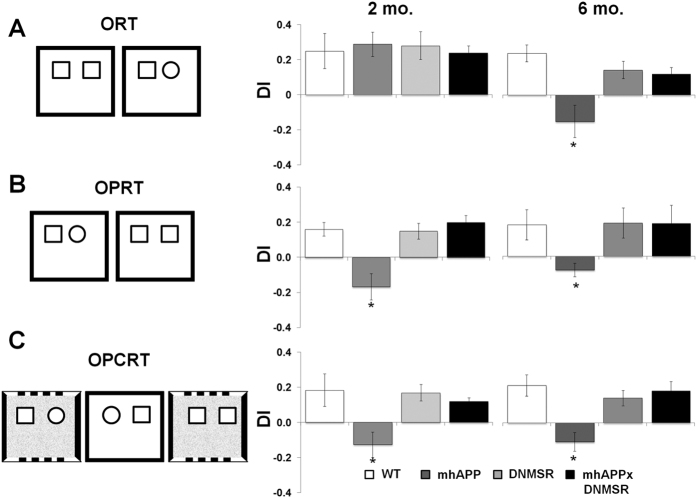
Figure 4. Behavioural analysis.
In (A–C) left panels report a schematic depiction of the sample and test trials within the novel object recognition tasks (ORT), novel object place recognition task (OPRT) and novel object place/contest recognition task (OPCRT), respectively; In (A–C) right panels, plots represent the average discrimination indices (DI) calculated for each group of either 2 month old or 6 month old mice. Data are presented as mean ± SEM; *p < 0.05 vs. other groups.

