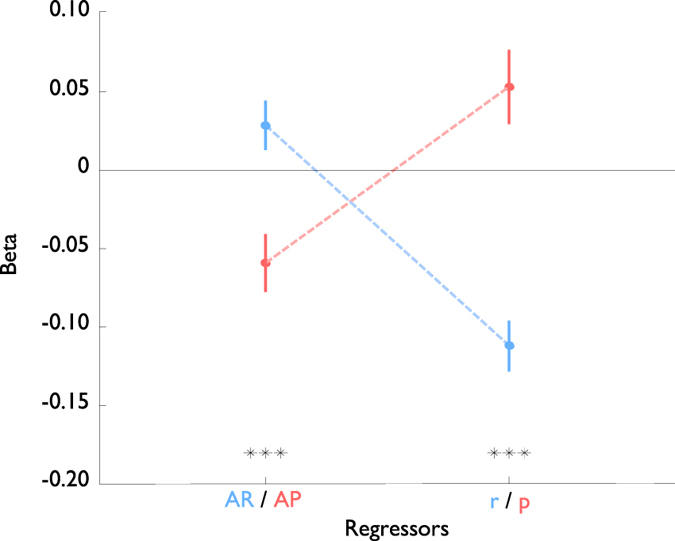
Figure 3.

Beta values (mean and standard errors) for available reward (AR, blue) and average reward (r, blue), based on rewarding subjects for being correct and fast, plotted against available punishment (AP, red) and average punishment (p, red), based on punishing subjects for being incorrect or slow. Reward data are re-plotted from Beierholm et al.5. ***p < 0.001.
