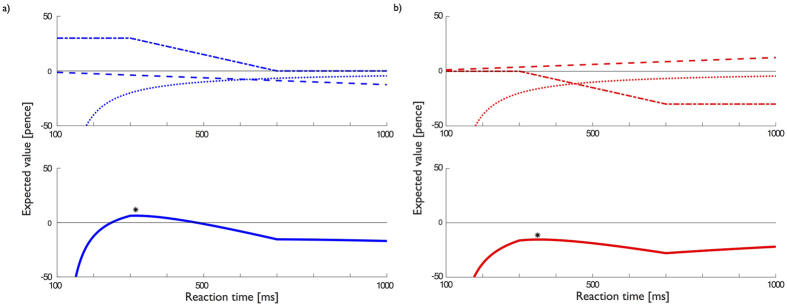
Figure 4.
(a) Punishment (red) and (b) Rewards (blue) influence the optimal response times for subjects. Top: An example of how the available punishment (reward), opportunity gain (cost) and movement cost add together to produce the total Expected value (Bottom) of making a reaction at time τ. Optimal behavior entails maximizing this function, indicated by *In each figure. For this figure parameters were K = 4000 ms*pence, a = 200 ms, t = 500 ms, rho = 0 pence. We assumed 100 ms for perceptual processing.

