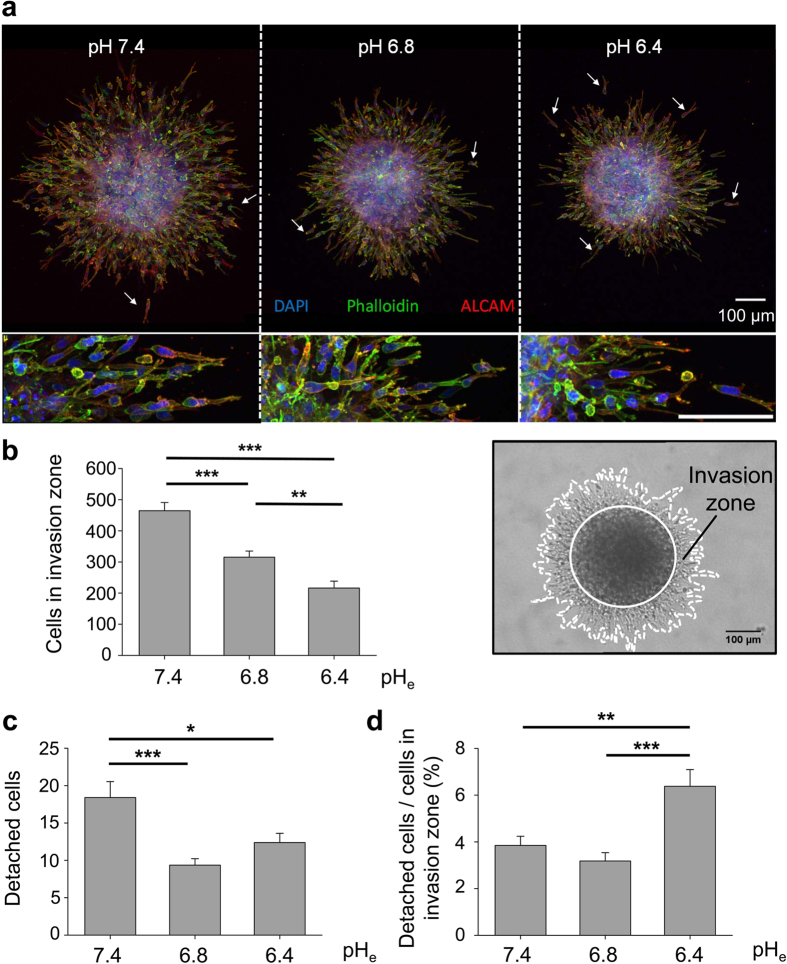
Figure 1. 3D emigration assays through a collagen I matrix.
(a) Maximum projection images of z-stacks obtained by confocal laser scanning microscopy reveal that acidification (i) controls melanoma cell migration by lowering the area of invasion and (ii) increases the number of detached cells (white arrows) after 24 h. Activated leukocyte cell adhesion molecule (ALCAM) is expressed in all three conditions. Scale bar = 100 μm in images of higher magnification in the second row. (b) Quantification of the number of cells that migrate into the collagen mesh and form the invasion zone around the initial spheroid. The invasion zone is calculated as the difference of the total area of the spheroid (dashed white line) and the area of the spheroid core (solid white circle). Extracellular acidification decreases the absolute number of cells in the invasion zone (pHe7.4: 464.6 ± 26.1 cells (N = 5 experiments with n = 20 spheroids); pHe6.8: 315.3 ± 19.6 cells (N = 4, n = 19); pHe6.4: 216.4 ± 21.9 cells (N = 5, n = 24)). (c) Absolute number of cells that detach from the initial spheroid (pHe7.4: 18.4 ± 2.1 cells; pHe6.8 and pHe6.4 were 9.4 ± 0.9 and 12.4 ± 1.2 cells). (d) Number of detached cells normalised to the total number of cells in the invasion zone. Most cells detach at the lowest pHe value of 6.4 (pHe7.4: 3.85 ± 0.39%; pHe6.8: 3.18 ± 0.35%; pHe 6.4: 6.38 ± 0.72%). Statistical significance was observed by one-way ANOVA followed by student’s t-test (parametric data).

