
Figure 8. Schematic illustration of cell-cell adhesion analysis using AFM.
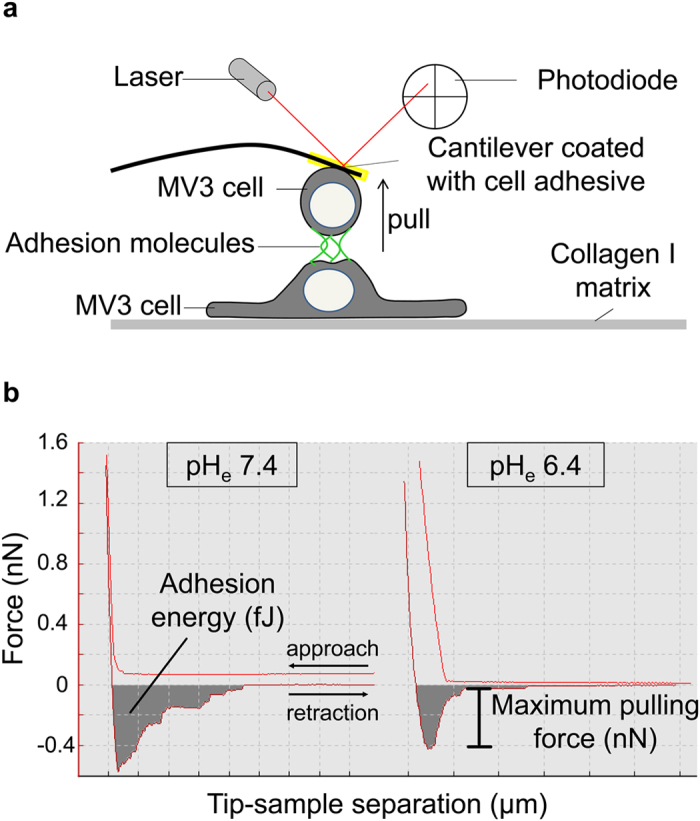
(a) Single cell force spectroscopy. A single melanoma cell (MV3) attached to a flexible cantilever is brought into contact with another adherent melanoma cell of the same kind seeded on collagen I. When lowering the cantilever (approach curve), a defined force of 1.5 nN is applied to bring the cells into contact. After a contact time of 2 seconds, the cells are mechanically separated by retraction of the cantilever in z direction (retraction curve). (b) Data analysis. Representative force-distance curves for pHe7.4 and pHe6.4 illustrate the data analysis: the required adhesion energy is calculated from the area under the curve. The maximum pulling force needed to separate two individual melanoma cells is calculated from the lowest turning point of the retraction curve.