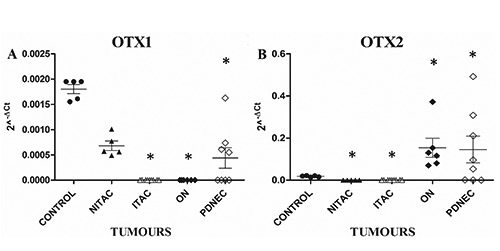
Figure 2.

Molecular expression of OTX1 (A) and OTX2 (B) genes in normal and neoplastic nasal tissues. Normal mucosae (control) (5 analysed cases), non-intestinal-type adenocarcinomas (NITAC) (5 analysed cases), intestinal-type adenocarcinomas (ITAC) (9 analysed cases), olfactory neuroblastomas (ON) (6 analysed cases), poorly differentiated neuroendocrine carcinomas (PDNEC) (8 analysed cases). The X axis indicates the type of tumour, while the Y axis represents the 2^-ΔCt values. The asterisk indicates data statistically significant (P<0.05) between control and tumours obtained by Student’s t-test.
