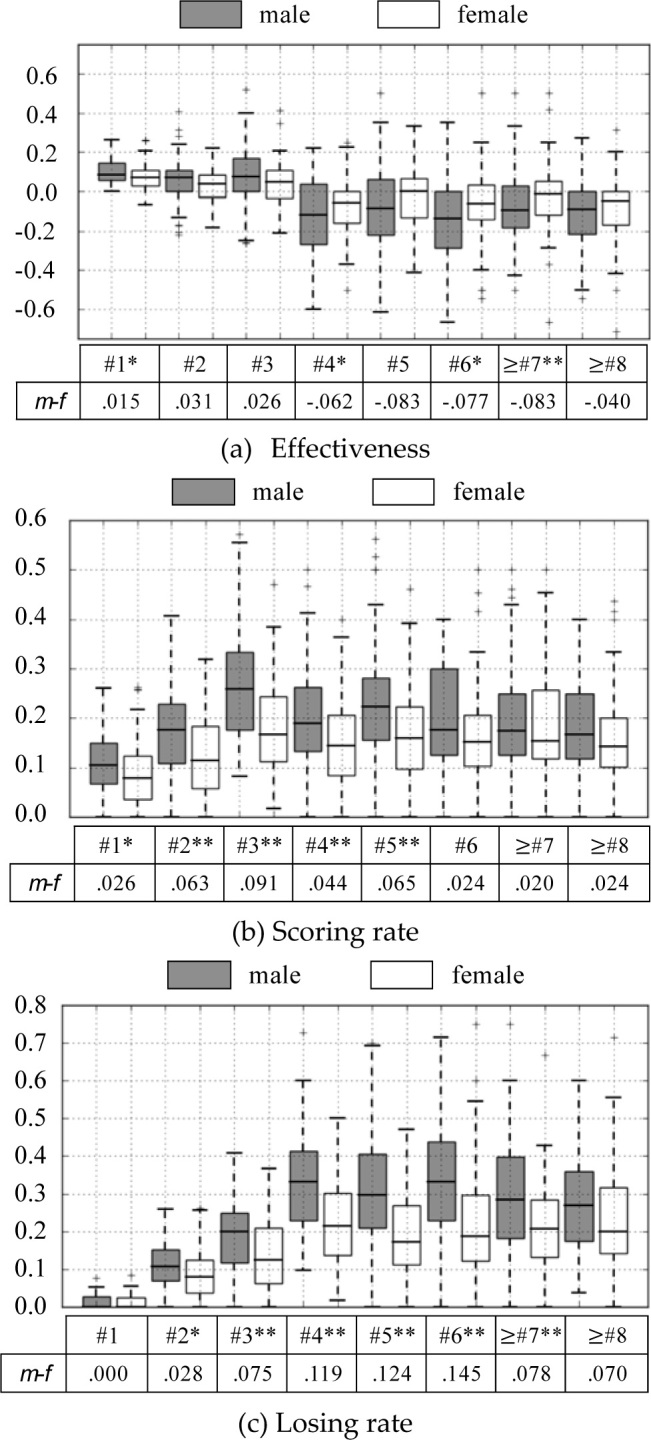
Figure 1.

Distribution of performance indicators of male and female players. The box and whiskers denote the maximum, minimum, median, first quartile and third quartile. The cross markers denote outliers, of which distance from the box is 1.5 times as much as the length of the interquartile range. m-f Difference of median between male and female players. *: Significantly different between genders (p < .05). **: Significantly different between genders (p < . 01).
