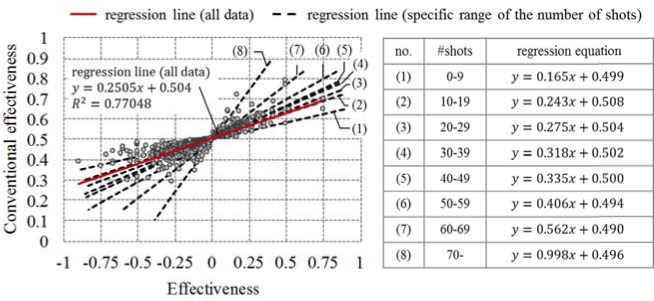
Figure 3.
Correlation between effectiveness of the proposed method and conventional effectiveness. The solid line denotes the regression line computed with all data. The dashed line denotes the regression line computed from the data of shot numbers where specific range of the number of shots was performed. The regression equation corresponding to the dashed lines is shown in the table next to the scatter plot, ttshots: the range of the number of shots.

