
Figure 1.
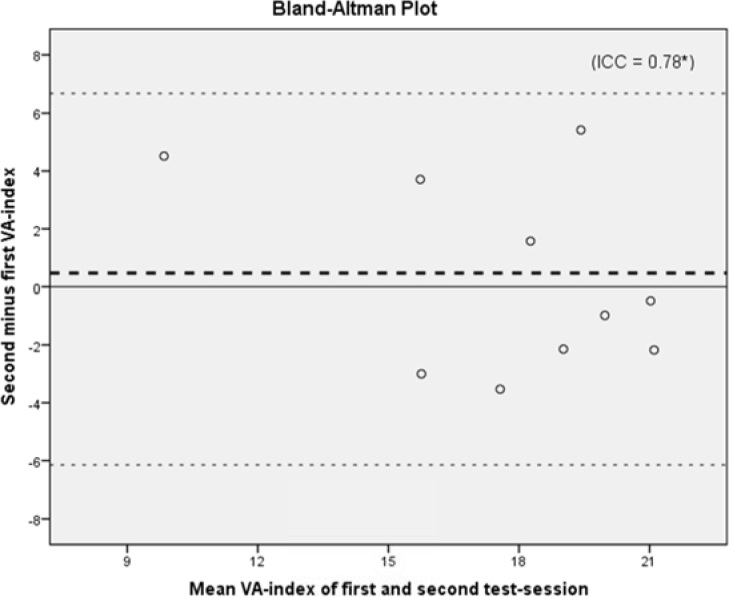
Bland-Altman plot for the test-retest reliability in youth tennis players (n = 10). The bold dotted line represents the difference in the mean VA-index between the first and the second test-session. The non-bold dotted lines represent the 95% limits of agreement (± 1.96 × SD). ICC: intra-class correlation coefficient (model: one-way random); * p < .05.