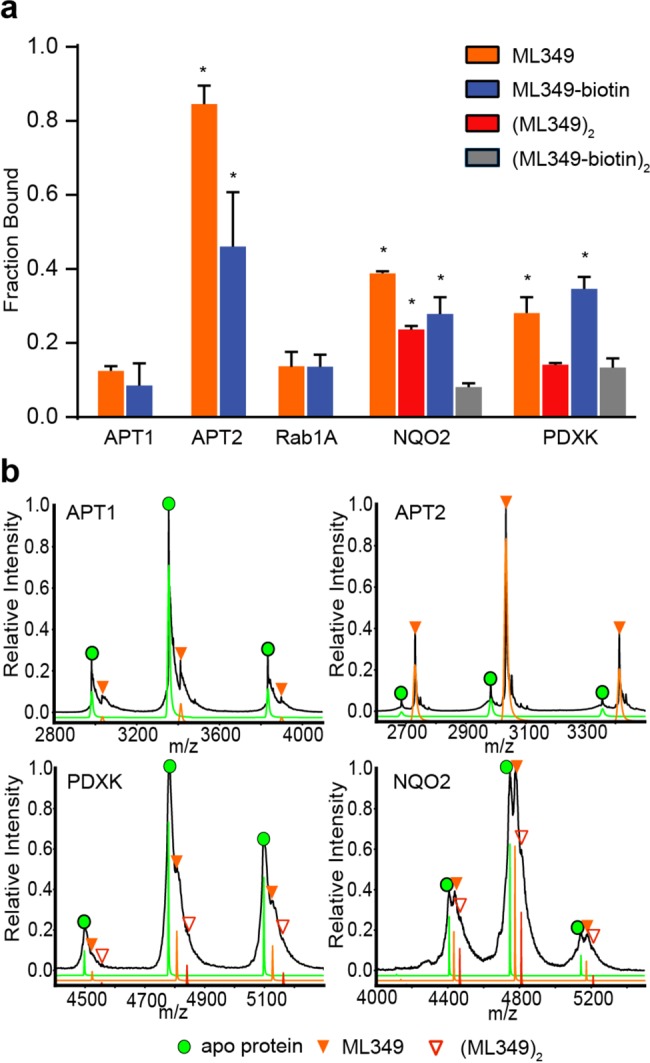
Figure 4.

Native mass spectrometry profiling of inhibitor engagement and stoichiometry. (a) Graphical distribution of ligand–protein complexes derived from native mass spectrometry analysis. NQO2 and PDXK formed observable dimers, forming two potential ligand binding sites per complex. Red bars represent occupancy at both binding sites, representing two ML349 molecules per dimer. Gray bars represent complete occupancy of ML349-biotin in NQO2 and PDXK. Asterisks (*) indicate a p-value less than 0.05, as compared to the nonspecific binding to APT1 (n = 3, standard deviation). (b) Representative mass/charge spectra with three charge states used for quantitation of proteins binding to ML349 before (black trace) and after deconvolution (green = apo protein, orange = ML349 bound protein, red = 2xML349 bound protein) are shown for each protein.
