
Figure 4.
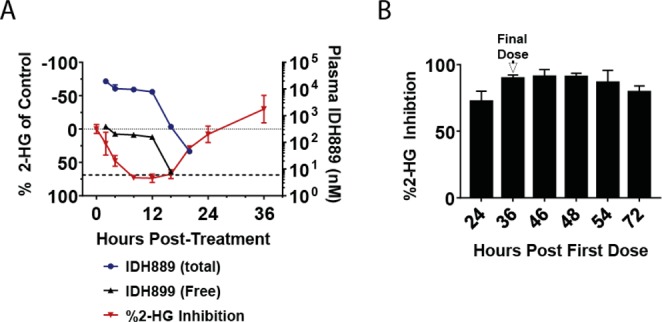
(A) Total and estimated free plasma IDH889 concentration (mean ± SD) and percent inhibition of baseline 2-HG levels (mean ± SEM) in HCT116-IDH1R132 xenograft tumor tissue following a single 200 mg/kg dose (dotted line is zero % inhibition, dashed line represents cellular EC50). (B) Percent inhibition (mean ± SEM) of 2-HG levels in tumor tissue following four doses of IDH889 at 25 mg/kg po BID (q12/12).