
Figure 5.
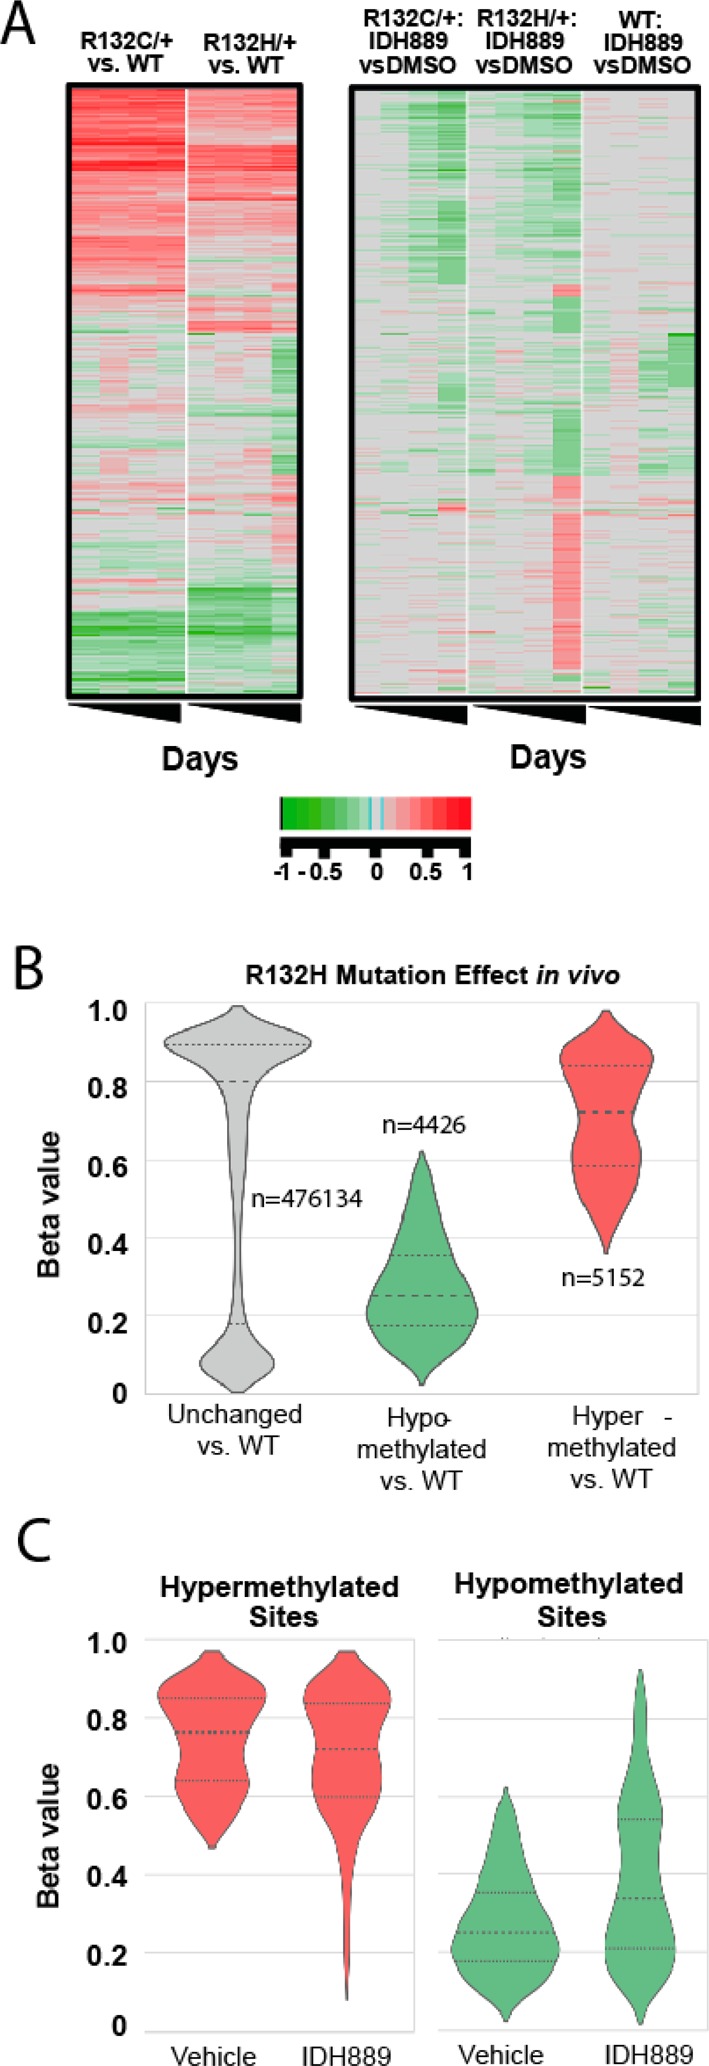
(A) In vitro DNA methylation changes upon IDH889 treatment in the indicated HCT116 cell clones. Rows represent individual sites in the genome, and columns within each cluster represent time points (days 3, 7, 14, and 28). Green shading indicates hypomethylation, and red shading indicates hypermethylation, delta values as described in Supporting Information. (B) Violin plots showing in vivo DNA methylation changes in IDH1R132H/+ mutant vs wild-type HCT116 xenograft tumors. Y axis level of methylation for each site (1 = methylated, 0 = unmethylated: beta values, as described in Supporting Information), n = number of sites within each group, large dashed line indicates median beta value, and smaller dashed lines indicate 75th (top) and 25th (bottom) percentiles. (C) Violin plot as in panel B for IDH1R132H mutant tumors after treatment with IDH889 (tumors from Figure 4B).