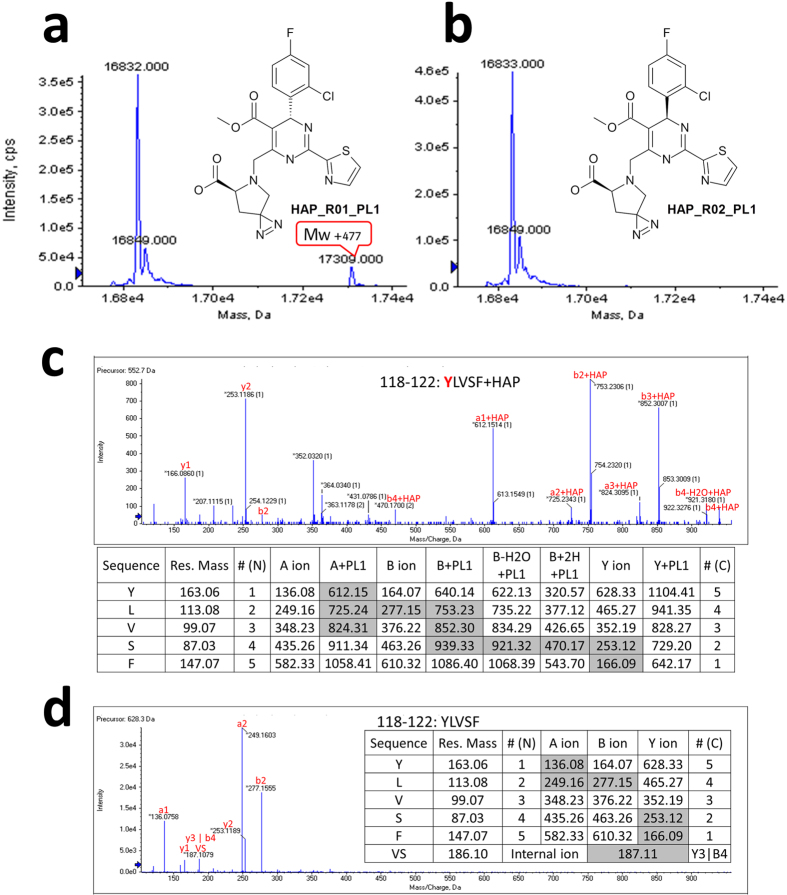
Figure 4. Identification of photoaffinity labeling site Y118 by HAP_R01_PL1.
(a) Intact mass measurement of the active photolabel HAP_R01_PL1-treated sample. Mw increase of 477 is highlighted in red box indicating the covalent labeling of HAP_R01_PL1 on core protein assembly. (b) Intact mass measurement of the control photolabel HAP_R02_PL1-treated sample. (c,d) MS2 data of pepsin-digested peptide 118–122: YLVSF from photoaffinity label-treated samples. Inlet tables show the calculated mass of fragmented ions. Grey shading denotes observed fragment ions. (c) HAP_R01_PL1-treated sample. (d) HAP_R02_PL1-treated sample.

