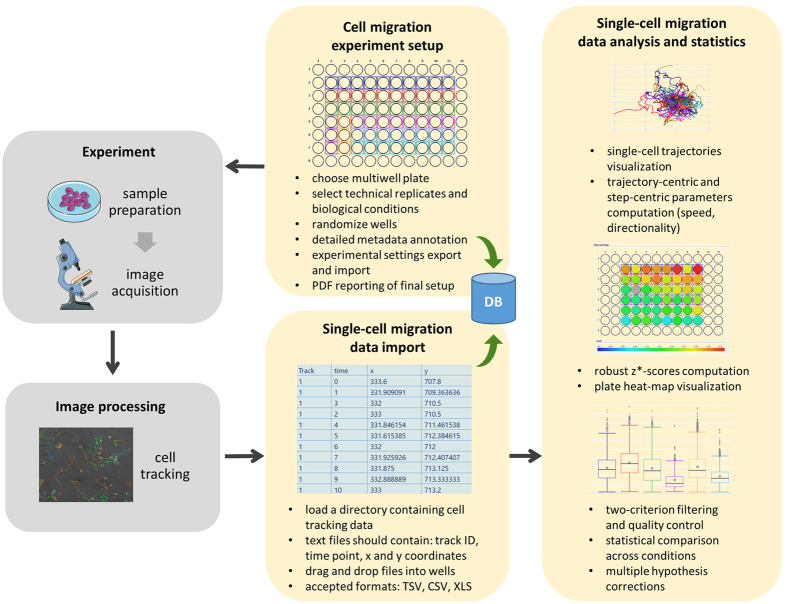
Figure 1. Schematic workflow of the single-cell analysis module presented in this article.
Yellow boxes highlight the steps in which the modules operates, together with the broader CellMissy framework and database. The key functionalities of the software are listed for each block. Images in the ‘Experiment’ block by Servier Medical Art, distributed under a CC-BY 3.0 license (http://www.servier.com/Powerpoint-image-bank, https://creativecommons.org/licenses/by/3.0/).

