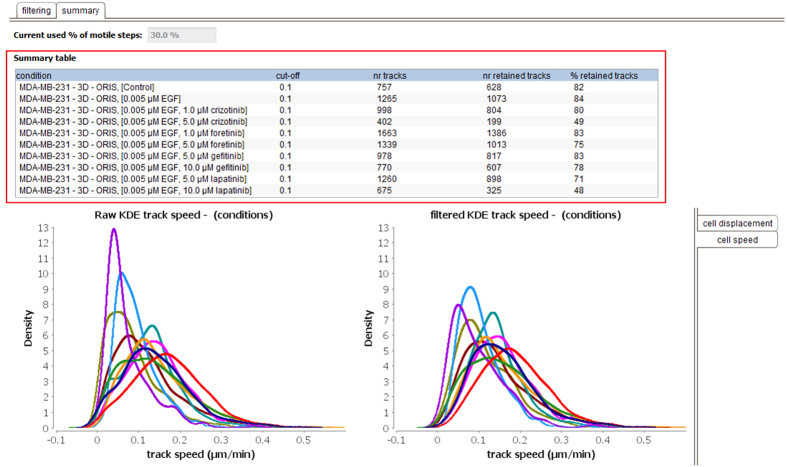
Figure 10. The summary filtering view of the software.
The summary table (red box) reports the cut-off used for each condition of the experiment, together with the initial and the retained number of cell trajectories. The final effect of the filtering can be evaluated with the density plots of raw and filtered displacement and speed distributions (bottom panels, different colors represent biological conditions reported in the table). This functionality is here shown for experiment 2; control in dark blue, high dose crizotinib in purple, and high dose lapatinib in olive green.

