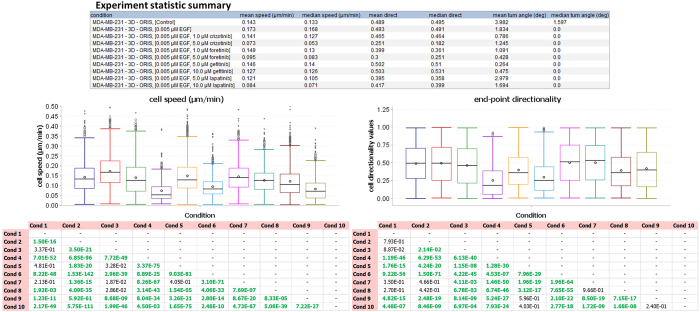
Figure 12. Results views.
Parts of final views are shown. The experiment statistics summary is reported in the table. Boxplots are shown for cell speed and end-point directionality values. The two tables at the bottom report p-values from a Mann-Whitney U test performed on speed (left) and directionality (right) distributions. P-values smaller than 0.05 (significance level can be chosen in the tool) are highlighted in green. A multiple hypotheses testing with Benjamini-Hochberg correction is applied. Data shown in this figure are from experiment 2.

