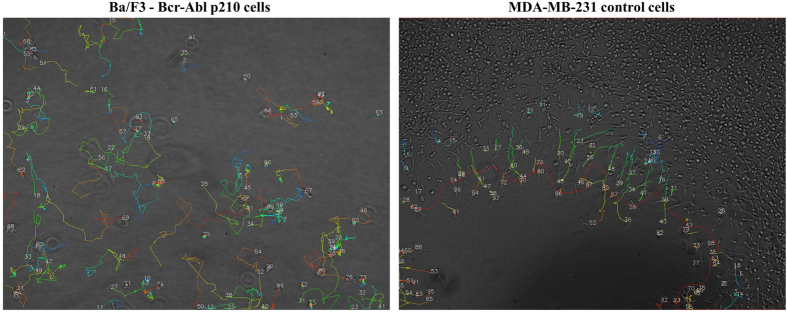
Figure 3. Single-cells trajectories acquired by time-lapse imaging and image processing.
Cell trajectories (colored lines) obtained from applying tracking software on a time-lapse image sequence and overlaid on the last image of the sequence for Ba/F3 cells expressing p210 Bcr-Abl (left, experiment 1, sparsely seeded cells, Table 2) and for untreated MDA-MB-231 cells (right, experiment 2, cell exclusion zone assay, Table 2). Numbers indicate individual cell trajectories. Colors indicate temporal evolution of x and y cell positions (blue: earlier in time, red: later in time). The red line in the right image indicates the border between the confluent cell layer and the cell-free zone that has shifted in time. Single cells are only identified as such in experiment 2 when they escape the expanding cell sheet.

