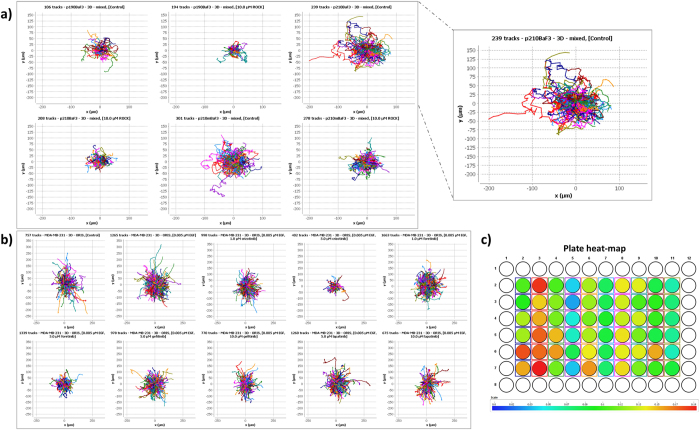
Figure 4. Visualizing the effects on migration via rose plots of single-cell trajectories.
Each rose plot visualizes all cell trajectories present in the tested biological conditions (cumulated data of the replicates per condition, number of trajectories are indicated on the top left of each panel). The origin of all trajectories has been shifted to (0,0). (a) Six conditions of experiment 1; the rose plots for conditions 2, 4 and 6 where cells were incubated with ROCK inhibitor clearly demonstrate the inhibitory effect. Zoomed view of condition 3 is shown in the box. (b) Ten conditions of experiment 2; condition 1: no treatment, condition 2: EGF treatment, conditions 3–10: EGF plus various drugs. Note e.g., the drug concentration-dependent effect in condition 3 vs. 4, and 5 vs. 6, treated with 1 and 5 μM of crizotinib or foretinib, respectively. (c) Plate heat-map visualization of experiment 2: each well in the plate color encodes median cell speed.

