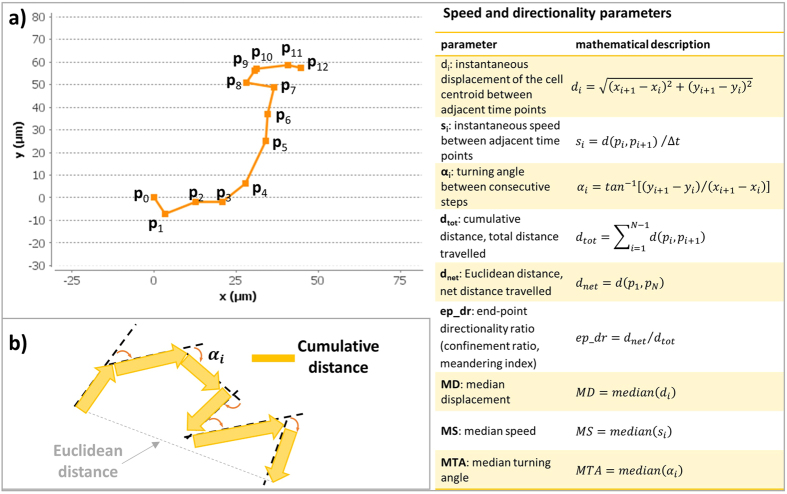
Figure 6. Parameters extracted from a single-cell trajectory in the 2D Euclidean space.
(a) Schematic representation of a cell track consisting of 12 steps. The parameters reported in the table on the right are computed for each trajectory. (b) Schematic representation of net and cumulative Euclidean distance travelled by the cell. The turning angles αi between successive time frames are shown.

