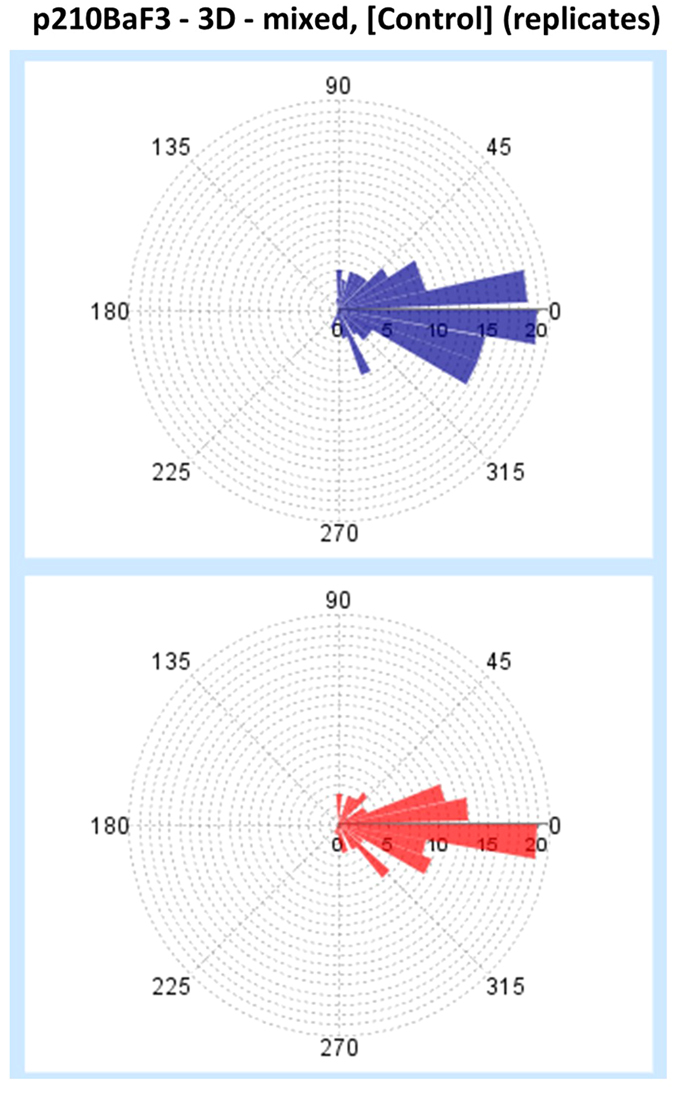
Figure 8. Cell turning angle distributions are visualized via angular histograms.

Turning angle distributions are shown for the untreated p210Bcr-Abl Ba/F3 cells (condition 3, experiment 1). Each distribution corresponds to a specific technical replicate. The angular bin is 10 degrees.
