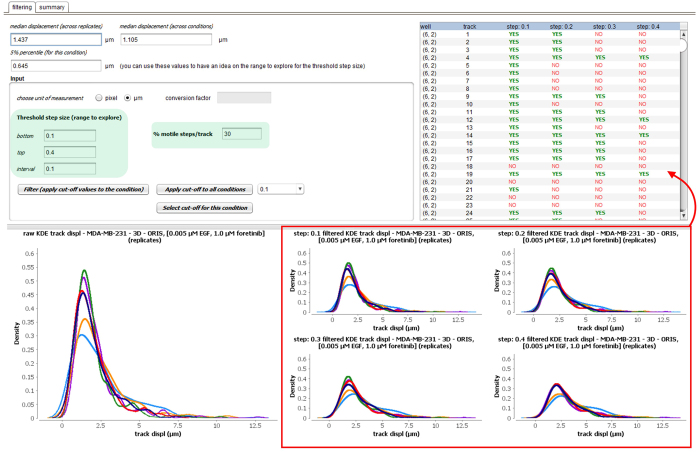
Figure 9. The quality control view of the software: two-step thresholding.
The user can input a range for the threshold step size (i.e., displacement) to be tested (box on the left). The choice is guided by displaying the median and 5% percentile of the displacement distribution for the condition (across replicates) and the experiment (across conditions). Second, the user inputs a percentage of desired motile steps per cell trajectory (box on the right). The effect of each tested threshold value for the displacement can be evaluated through the density plots of the track displacement distributions (red box). For each tested value (columns), the table reports the list of cell trajectories (rows) marked in green (YES) if retained, and in red (NO) if not retained. This functionality is here shown for condition 3 of experiment 2.

