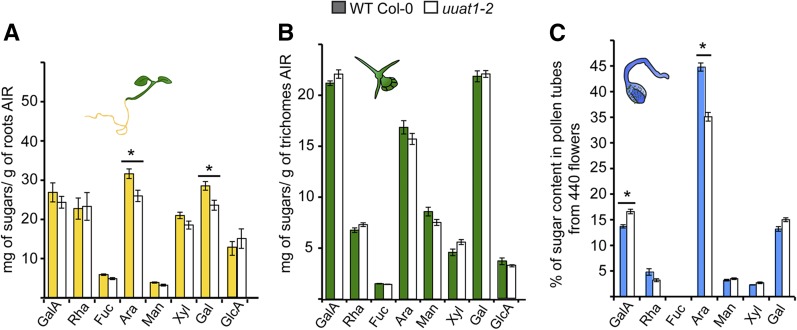
Figure 7.
Monosaccharide Composition of Different Organs, Tissues, or Cells from Wild-Type Col-0 and uuat1-2 Mutant Plants.
Quantification of the monosaccharide composition of the cell wall extracts from wild-type Col-0 and uuat1-2 mutant plants using HPAEC-PAD and gas chromatograph-flame ionization detection. Error bars represent se (n = 6) from three biological replicates. Asterisk indicates significant differences from the wild type using the Wilcoxon test (P < 0.05).
(A) Roots from 7-d-old plants.
(B) Trichomes from 14-d-old plants.
(C) Pollen tubes from 6-h-old plants.

