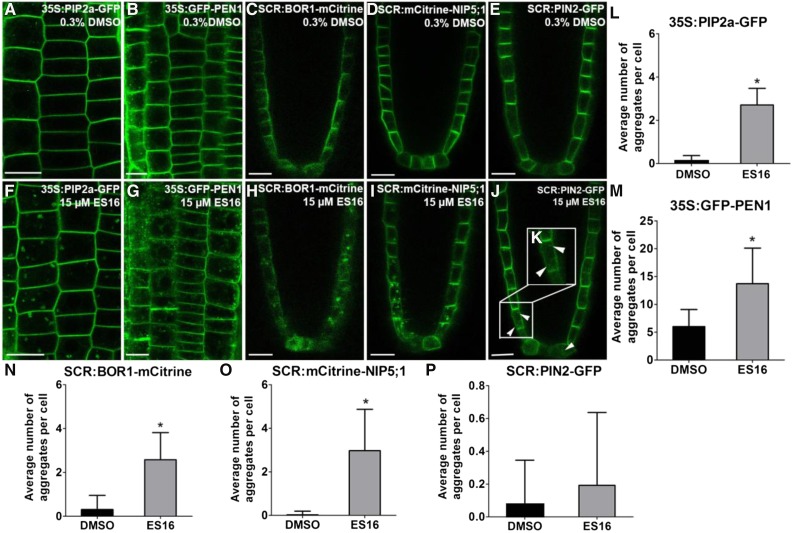
Figure 2.
ES16 Also Disturbs Nonpolar and Lateral Localization of Plasma Membrane Proteins.
(A) to (D) Images of root cells from 35S:PIP2a-GFP (A), 35S:GFP-PEN1(B), SCR:BOR1-mCitrine (C), SCR:mCitrine-NIP5;1 (D), or SCR:PIN2-GFP (E) after 0.3% DMSO treatment for 1 h.
(E) to (H) Images of root cells from 35S:PIP2a-GFP (F), 35S:GFP-PEN1(G), SCR:BOR1-mCitrine (H), SCR:mCitrine-NIP5;1 (I), or SCR:PIN2-GFP ([J] and [K]) after 15 µM ES16 treatment for 1 h.
(K) Zoom-in image of the cells close to the quiescent center where the polarity of PIN2 is not obvious.
(L) to (P) Quantification of aggregates induced by ES16 compared with DMSO control. Quantification is calculated by measuring the number of aggregates in each cell; 200 cells from 10 seedlings were chosen for quantification per treatment per genotype. Note that the y axis scales for (M) and (P) differ from those of (L), (N), and (O). The significance of difference was calculated by a two-tailed Student’s t test, and the asterisks represent P < 0.01. Images are representative from three repeats. Error bars represent sd. Bars = 10 µm.

