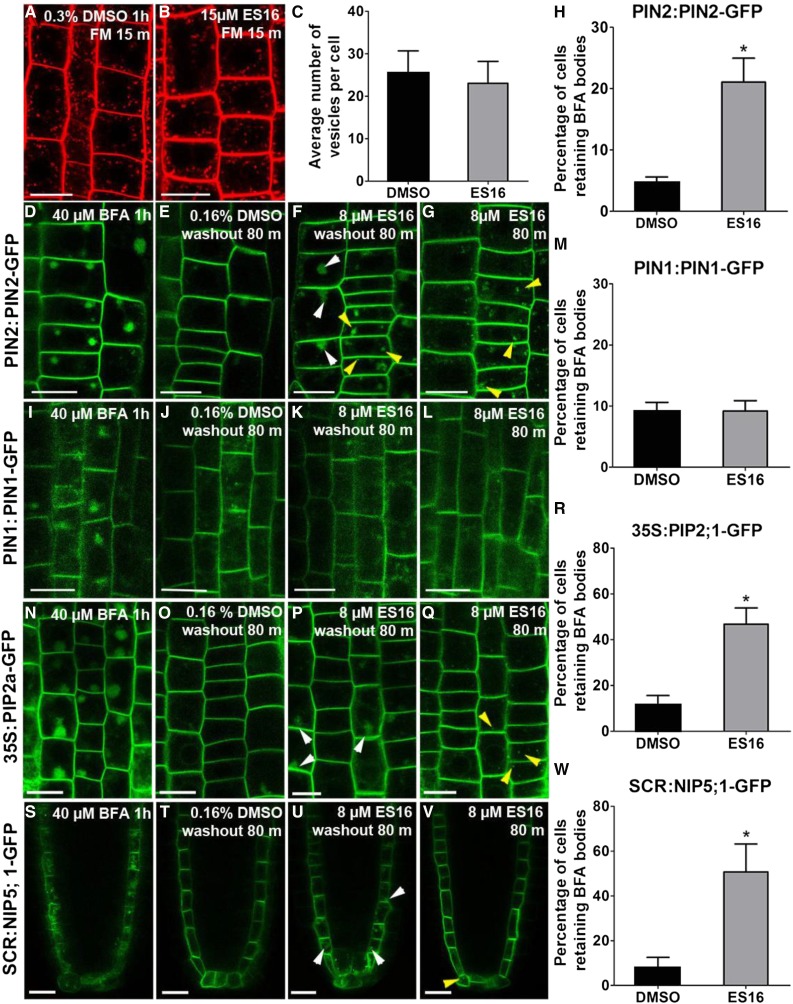
Figure 5.
ES16 Inhibits Recycling but Not Endocytosis.
(A) and (B) Images of FM4-64 uptake after pretreatment with either 0.3% DMSO (A) or 15 µM ES16 (B).
(C) Quantification of internalization of FM4-64 dye after 15 min uptake as shown in (A) and (B). Quantification was based on counting the number of FM vesicles in each cell; 200 cells from 10 seedlings were chosen for quantification per treatment.
(D), (I), (N), and (S) Large aggregates induced by BFA in root cells of PIN2:PIN2-GFP (D), PIN1:PIN1-GFP (E), 35S:PIP2a-GFP (N), and SCR:NIP5;1-mCitrine (S) lines.
(E), (J), (O), and (T) Root cells after 80 min washout in the presence of 0.16% DMSO, with almost all the BFA bodies in the root cells recycled back to the PM.
(F), (K), (P), and (U) Washout in the presence of 8 µM ES16 showed reduced recycle efficiency of PIN2 (F), PIP2a (P), and NIP5;1 (U) but not PIN1 (K).
(G), (L), (Q), and (V) Small agglomerations of PIN2 (G), PIP2a (Q), and NIP5;1 (V) but not PIN1 (Q) in the presence of 8 µM ES16.
(H), (M), (R), and (W) Quantification of BFA washout efficiency. Quantification was calculated using the ratio of the cells retaining BFA bodies to total cells in the same seedling. Note that the y axis maximum values for (H) and (M) differ from those of (R) and (W). Images are representative from three repeats; 15 seedlings were quantified per treatment per repeat. A two-tailed Student’s t test was used to calculate significance and asterisks represent P < 0.01. Error bars represent sd. Bars = 10 µm.

