Figure 8.
ES16 Functions through the Regulation of RabA GTPases.
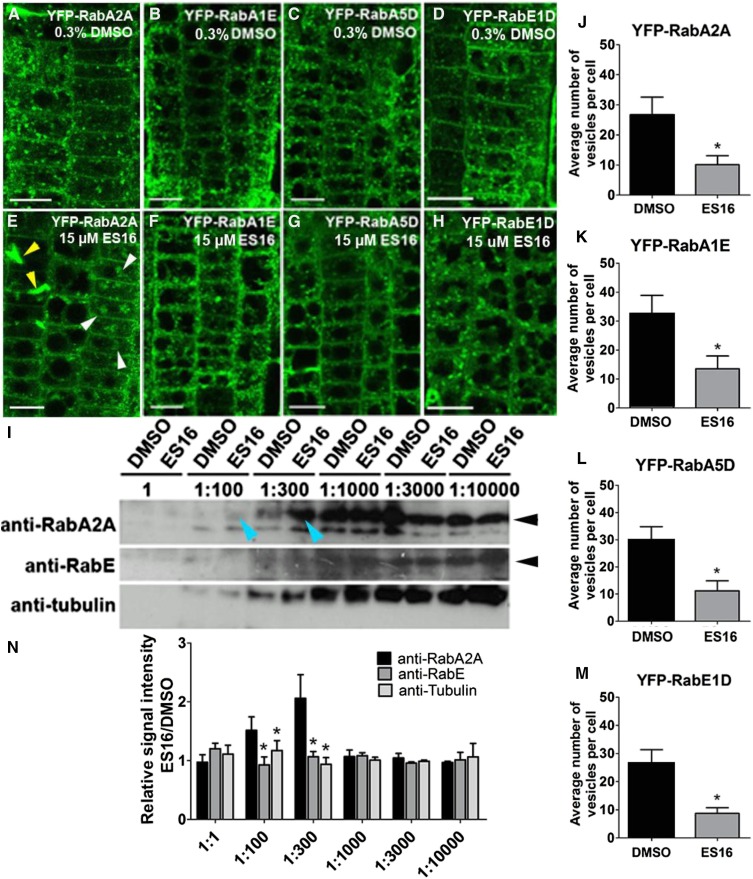
(A) to (D) Subcellular localization of RabA2A (A), RabA1E (B), RabA5D (C), and RabE1D (D) after treatment with 0.3% DMSO.
(E) to (H) Subcellular localization of RabA2A (E), RabA1E (F), RabA5D (G), and RabE1D (H) after treatment with 15 µM ES16. White arrowheads in (E) represent large aggregates and the yellow arrowheads represent cell wall stubs.
(I) Pretreatment with ES16 specifically protected RabA2A but not RabE or TUBULIN from degradation in a DARTS assay. Blue arrowheads indicate 1:100 and 1:300 dilution of pronase. Black arrowheads indicate the correct mass of the corresponding proteins.
(J) to (M) Quantification of vesicle number after ES16 treatment as shown from (A) to (H). Quantification was based on the number of vesicles in each cell; 200 cells from 10 seedlings were chosen for quantification per treatment per genotype.
(N) Quantification of bands intensity as shown in (I). The image was first reversed by Image J, and the net signal intensity of bands from ES16-treated sample was normalized against the ones from DMSO-treated sample with the same dilution ratio of pronase. Three representative scanned immunoblots were used for quantification. A two-tailed Student’s t test was used for significance calculation. For (J) to (M), asterisks represent P < 0.01; for (N), asterisks represent P < 0.05. Images are representative of three repeats. Bars stand for sd. Bars = 10 µm.

