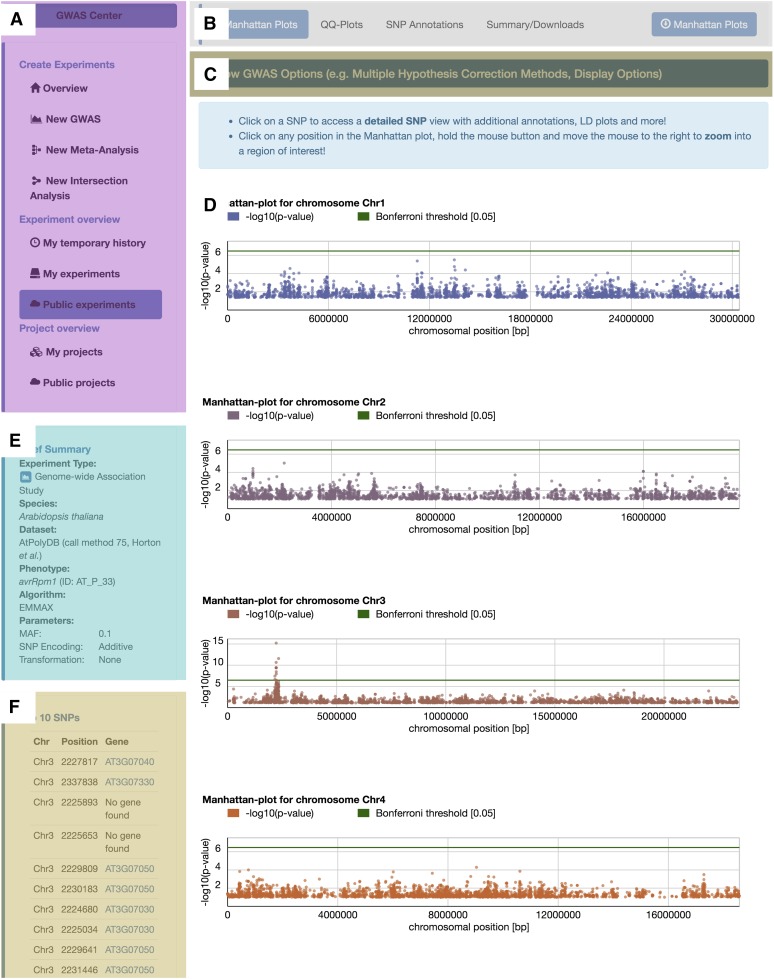
Figure 2.
Screenshot of the easyGWAS Result Layout.
The screenshot shows the general layout of the easyGWAS result view.
(A) The “GWAS Center” menu with links to different wizards and experiment tables, e.g., to create new GWAS, meta-analysis, or comparative intersection experiments.
(B) A sub-menu for the GWAS results to navigate between Manhattan plots, QQ-plots, SNP annotations, or an experiment summary.
(C) General options to dynamically adjust the multiple hypothesis testing method or various different plotting options.
(D) The main results of a GWAS, meta-analysis, or intersection analysis. In this screenshot, Manhattan plots are shown.
(E) and (F) A brief summary of the most important experimental parameters is shown (E). This can be either a summary of a regular GWAS experiment, a meta-analysis, or a comparison of several GWAS. If available, the top 10 associated hits of a GWAS are shown in (F).

