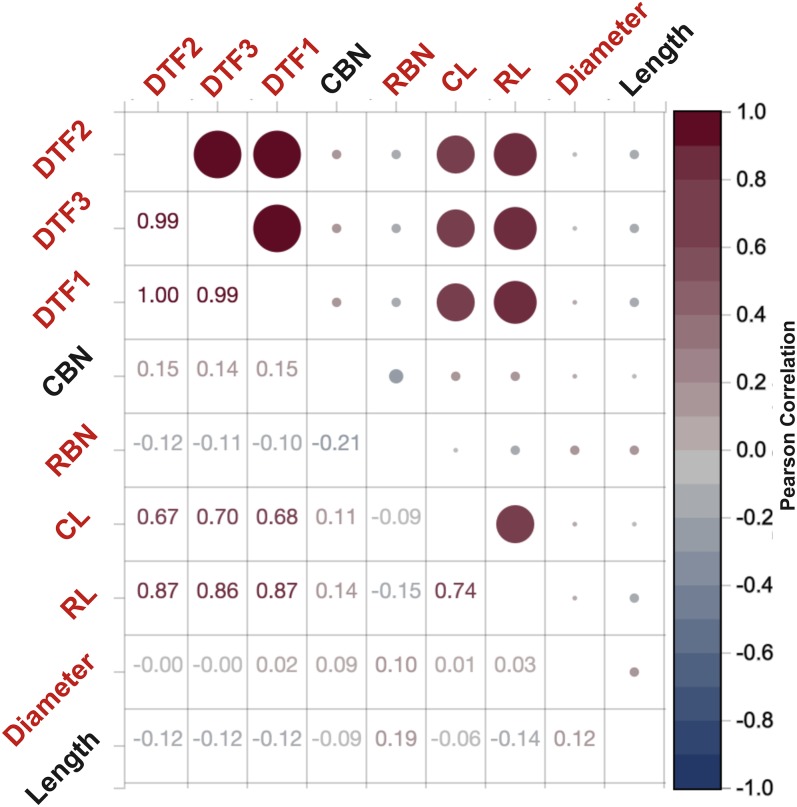
Figure 5.
Phenotype-Phenotype Correlation Plot for Case Study.
Phenotype-phenotype correlation plot showing the pairwise Pearson’s correlation coefficients between all phenotypes for the case study in Arabidopsis. Five of the phenotypes are highly correlated to each other: flowering time as days until emergence of visible flowering buds in the center of the rosette from time of sowing (DTF1); flowering time as days until the inflorescence stem elongated to 1 cm (DTF2); flowering time as days until first open flower (DTF3); rosette leaf number (RL); and cauline leaf number (CL). Phenotypes highlighted in red are significantly associated with population structure.

