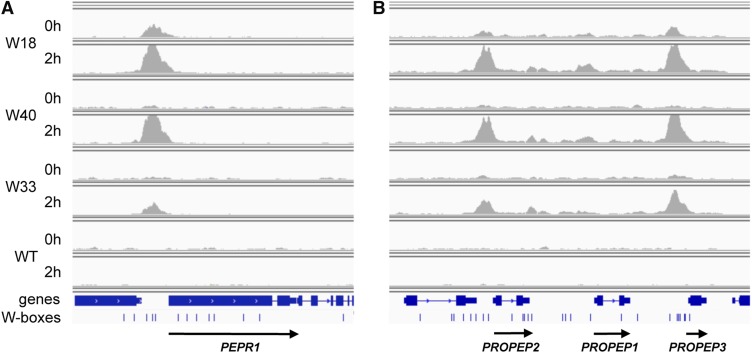
Figure 5.
WRKY18, WRKY40, and WRKY33 Binding to the PEPR1, PROPEP2, and PROPEP3 Loci.
IGV images of the PEPR1 (A) and PROPEP1-3 loci (B). Binding of WRKYs is visualized by read coverage histograms indicating sequencing read accumulation before (0 h) or after flg22 treatment (2 h). Wild-type samples served as negative control. The three lower tracks show the corresponding gene structures, position of W-boxes, and the direction of transcription (arrows).

