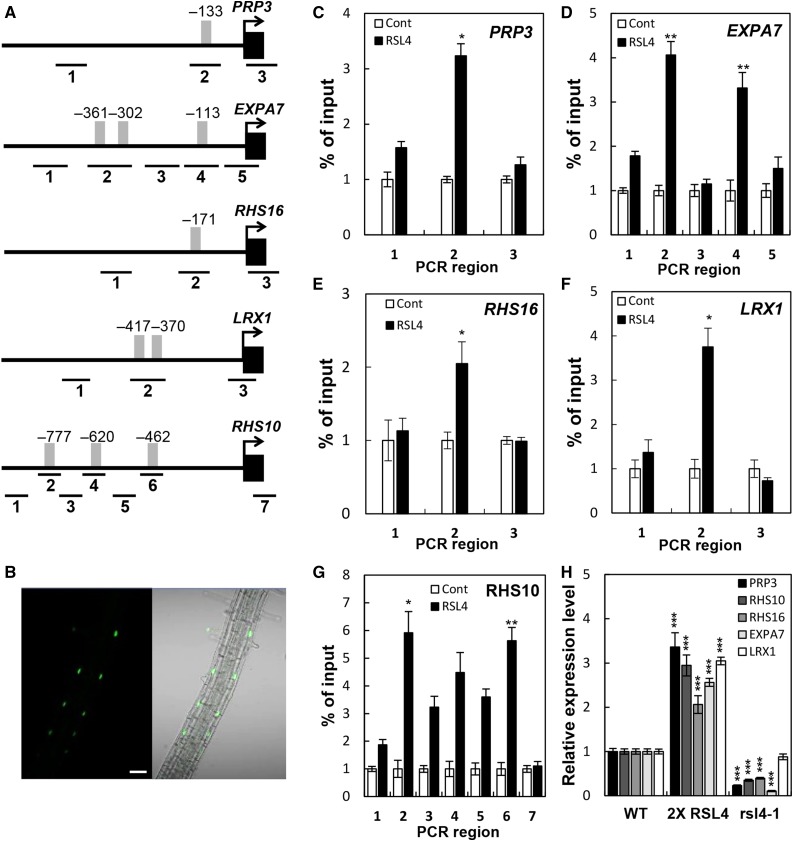
Figure 3.
ChIP Analyses Showing RSL4 Binding to the RHE Region of RHS Gene Promoters.
(A) Locations of the RHE (gray bars) and ChIP-PCR regions (lines with #1–7) in the RHS gene promoters. Positions are relative to the start codon (+1).
(B) Confocal microscopy images showing RSL4:GFP (ProRSL4:RSL4:GFP in the wild-type background) signals in the nuclei of root hair cells. Bar = 50 μm.
(C) to (G) Enrichment fold of the ChIP-PCR fragment from the region shown in (A). The ChIP analysis was done with the wild type (Cont) and ProRSL4:RSL4:GFP (RSL4) transformant plants. Error bars indicate ±sd from three biological repeats. Values are relative to each Cont value and significantly different (*P < 0.05; **P < 0.005; Student’s t test) from the control value.
(H) RT-qPCR analysis of RHS transcripts from the wild type, ProRSL4:RSL4:GFP in the wild-type background (2× RSL4), and the rsl4-1 mutant. Error bars indicate ±sd from two biological repeats. The values are relative to the wild-type values and significantly different (***P < 0.0001; Student’s t test) from the wild-type values.

