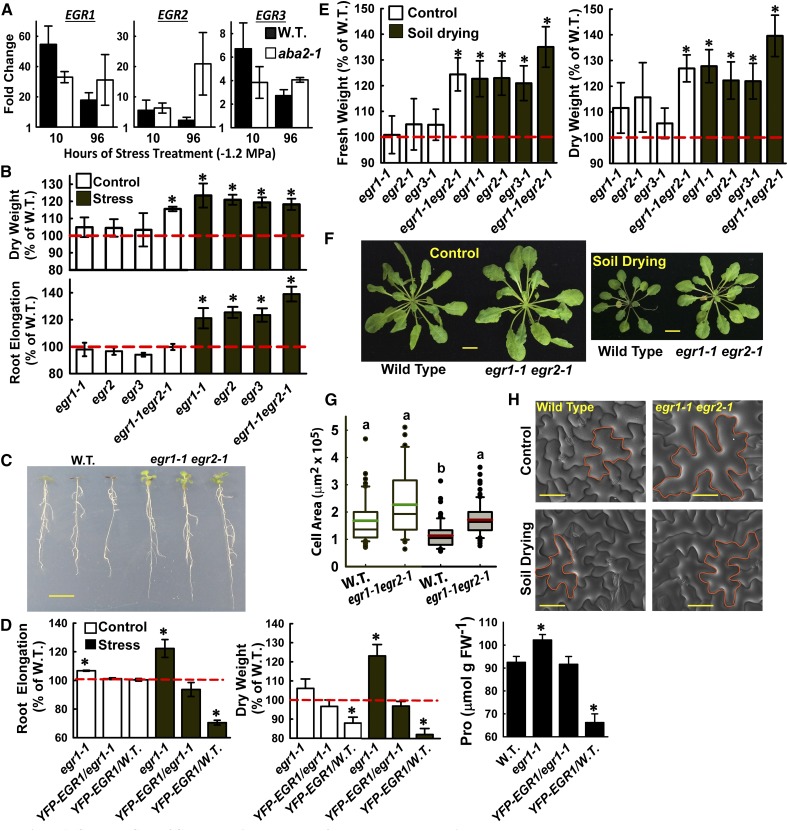
Figure 1.
Clade E EGR PP2Cs Are Negative Regulators of Growth and Cell Expansion.
(A) EGR expression at low ψw (−1.2 MPa) relative to the unstressed control for Col-0 (W.T.) and ABA-deficient mutant aba2-1. Data are means ± se, n = 6 from two independent experiments.
(B) Seedling dry weight (D.W.) and root elongation of the EGR mutant and overexpression lines in unstressed control conditions or 10 d after transfer to low ψw (−1.2 MPa). Data are relative to the wild type (mean ± se, n = 6 to 8 for seedling dry weight and n = 18 to 24 for root elongation, asterisk indicates significant difference compared with the wild type by one-sided t test [P ≤ 0.05]). Dashed red line indicates the wild-type level of growth (100%). Three or four seedlings were combined for each dry weigh measurement. egr2 and egr3 are combined data of two T-DNA alleles for each gene (Supplemental Figures 1A and 1D). Growth values of Col-0 wild type used for normalization are shown in Supplemental Figure 2.
(C) Representative seedlings of Col-0 wild type and egr1-1 egr2-1 after low ψw (−1.2 MPa) treatment. Five-day-old seedlings were transferred to low ψw and photographs taken 10 d later. Bar = 1 cm.
(D) Pro35S:YFP-EGR1 complements the increased growth and proline accumulation of egr1-1 and suppresses growth and proline in the wild type. Proline was measured 96 h after transfer to −1.2 MPa. Data are combined from two transgenic lines for both the egr1-1 and wild-type backgrounds and are means ± se (n = 4 to 12); asterisk indicates P ≤ 0.05 compared with the wild type. Dashed red line indicates the wild type level of growth (100%).
(E) Rosette fresh weight (F.W.) and dry weight for egr mutants in well-watered control plants or in plants subjected to partial soil drying. Data are expressed relative to the Col-0 wild type and are means ± se (n = 6 to 9) combined from two to three independent experiments. Two rosettes from plants grown in the same sector of the same pot were used for each fresh and dry weight measurement. Asterisks indicate significant difference compared with the wild type (P ≤ 0.05 by one-sided t test). Dashed red line indicates the wild-type level of growth (100%).
(F) Representative rosettes of the wild type and egr1-1 egr2-1 in control and soil drying treatments. Plants were 40 d old and were grown under short-day conditions. The soil drying treatment started at 18 d after planting and continued for 22 d with partial rewatering to control the extent of soil drying (see Methods for further details). Bars = 1 cm.
(G) Areas of epidermal pavement cells of leaf 6 from 38-d-old Col wild type and egr1-1 egr2-1 in control and soil drying treatments. Open boxes with green median lines show data for the unstressed control, and gray boxes with red median lines are stress treatment (black lines in each box indicate the mean, while box and whiskers indicate the 25 to 75 and 5 to 95 percentile ranges, respectively, and black circles show outlying data points). Data are means ± se (n = 40 to 80) combined from four to six plants. Lowercase letters above each box indicate significantly different groups (ANOVA on ranks, P ≤ 0.05; Supplemental Data Set 1).
(H) Representative scanning electron microscopy images with example epidermal pavement cells outlined in orange to illustrate the increased cell size in egr1-1 egr2-1, while retaining normal morphology. Bars = 50 μm.

