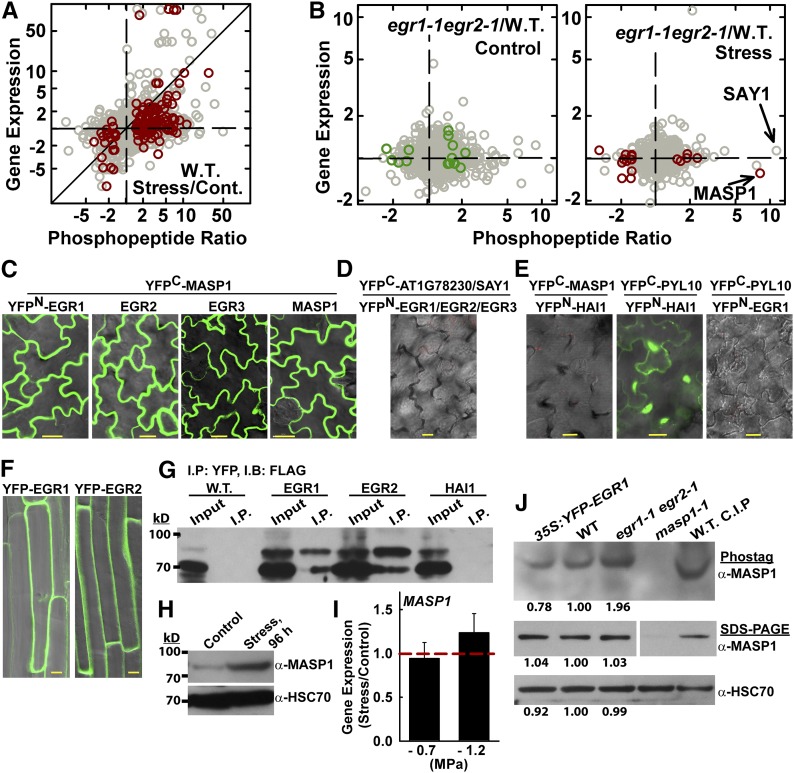
Figure 2.
Phosphoproteomics Analysis of Wild-Type and egr1-1 egr2-1 Plants Reveals Distinct Drought Effects on the Phosphoproteome and Identifies MASP1, an EGR-Interacting Phosphoprotein.
(A) Phosphopeptide abundance ratio versus gene expression for wild type (W.T.) stress versus control. Dark-red symbols indicate significant changes in phosphopeptide abundance (P ≤ 0.05 by one-sided t test and fold change ≥1.5). All other phosphopeptide data are plotted using gray symbols. Diagonal line indicates identical change in phosphopeptide abundance and gene expression. Data are fold change in phosphopeptide abundance (as indicated in the tick labels) plotted on a logarithmic scale. For the tick labels, ratios less than one were inverted and shown as negative fold change for clarity of presentation.
(B) Phosphopeptide abundance versus gene expression for egr1-1 egr2-1 versus the wild type in control and stress treatments. Format of data presentation is as described for (A). Dark red or green symbols indicate phosphopeptides with P ≤ 0.05 by one-sided t test and fold change ≥1.5 (with addition of MASP1, which has P = 0.07).
(C) BiFC interaction of MASP1 with EGRs and with itself in transient expression assays using intact Arabidopsis seedlings. Images of leaf epidermal pavement cells of unstressed seedlings are shown. Essentially identical results were seen in stress-treated (−1.2 MPa) seedlings. Bars = 20 μm.
(D) Representative image showing lack of interaction from BiFC analysis of EGRs with AT1G78320, a close homolog of MASP1, which lacks the MASP1 phosphorylation site (Supplemental Figures 3E and 3F and Supplemental Data Set 11) and SAY1 (Fig. 2B). Bars = 20 μm.
(E) Representative images showing the lack of BiFC fluorescence signal from the Clade A PP2C Highly ABA-Induced 1 (HAI1; AT5G59220) and MASP1 as well as EGR1 and PYL10 (identical results were seen for EGR2 and EGR3). The HAI1-PYL10 interaction was used as a positive control. Bars = 20 μm.
(F) Localization of YFP-EGR1 and YFP-EGR2 in stable transgenic plants. Cells in the root maturation zone of unstressed 11-d-old seedlings are shown. Similar localization was observed at low ψw. Bars = 10 μm.
(G) Coimmunoprecipitation of EGR1, EGR2, and MASP1. HAI1 and the uninfiltrated Avr-PTO line (W.T.) were used as a negative controls. YFP-tagged EGR1, EGR2, or HAI1 was transiently expressed along with FLAG-MASP1 and immunoprecipitation (I.P.) was performed with GFP-Trap resin to capture the YFP-tagged phosphatase. Immunoblot (I.B.) of the total protein extract (input) and immunoprecipitated proteins was performed using FLAG antisera. The experiment was repeated with similar results.
(H) Immunoblot using MASP1-specific antisera to detect endogenous MASP1 in wild-type seedlings under control or stress (−1.2 MPa, 96 h) conditions shows induction of MASP1 protein level at low ψw (100 μg of total protein was loaded per lane). Replicate blots were probed with HSC70 as a loading control.
(I) Quantitative RT-PCR analysis shows no increase of MASP1 expression in seedlings transferred to either −0.7 or −1.2 MPa low ψw stress for 96 h compared with unstressed plants. Data are means ± se (n = 6). Dashed red line indicates the level of expression in unstressed seedlings.
(J) Phos-tag gel analysis of MASP1 in stress-treated (−1.2 MPa, 96 h) seedlings. The identity of the phosphorylated MASP1 band was confirmed by analysis of masp1-1 and by treating the wild-type sample with calf intestinal phosphatase (C.I.P.). The same samples were also run on SDS-PAGE gels to assess MASP1 total protein level as well as HSC70 as a loading control (100 μg of protein was loaded per lane for both Phos-tag and regular SDS-PAGE). Band intensities relative to the wild type are shown for egr1-1 egr2-1 and Pro35S:YFP-EGR1 lines. For the MASP1 SDS-PAGE, all lanes are from the same blot, but intervening space was removed and part of the blot rotated to show the lanes in the same order as the other blots.

