Figure 3.
MASP1 Promotes Growth in a Phosphorylation-Dependent Manner and Is Localized in the Cell Cortex.
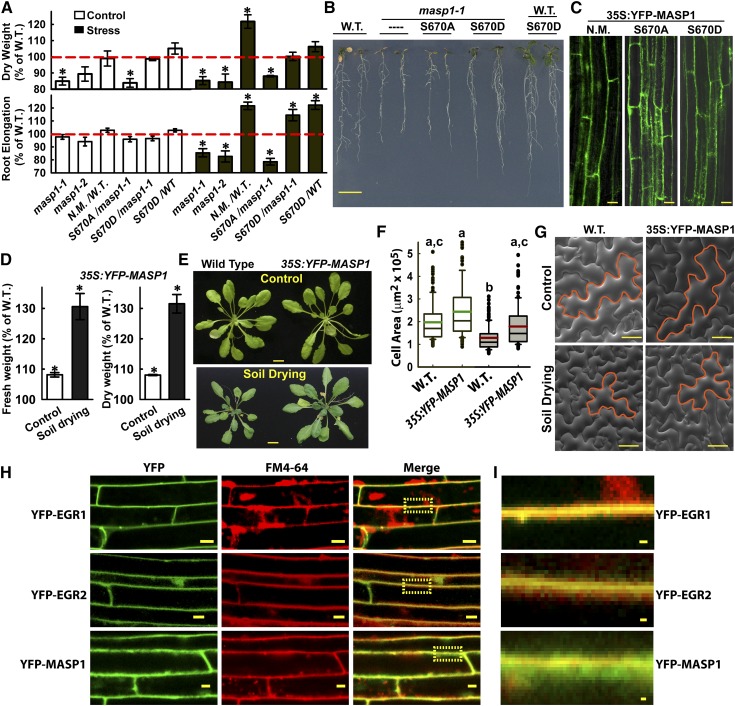
(A) Dry weight and root elongation of seedlings under control and stress (−1.2 MPa) conditions. Genotypes used were masp1-1 and masp1-2 as well as Pro35S:YFP-MASP1 expressed in the wild type (W.T.) or masp1-1. MASP1 alleles used in transgenic plants: N.M., no mutation wild-type MASP1; S670A, phosphonull MASP1; S670D, phosphomimic MASP1. Data are relative to the Col-0 wild type (mean ± se, n = 6 to 8, asterisk indicates significant difference compared with the wild type by one-sided t test [P ≤ 0.05]). Growth values of Col-0 wild type used for normalization are shown in Supplemental Figure 2. Dashed red line indicates the wild type level of growth (100%).
(B) Representative seedlings of Col-0 wild type (W.T.), masp1-1, masp1-1 transformed with MASP1S670A (phosphonull) or MASP1S670D (phosphomimic), and wild type transformed with MASP1S670D. Seedlings shown were subjected to −0.7 MPa low ψw treatment where MASP1-mediated effects on growth were similar or greater than the −1.2 MPa experiments shown in (A). Bar = 1 cm.
(C) Images of root cells showing that YFP-MASP1 unmutated (N.M.), phosphonull MASP1 (S670A), and phosphomimic MASP1 (S670D) all localized along the cell periphery and were expressed at a similar level. Bars = 20 μm.
(D) Relative rosette fresh weight and dry weight of Pro35S:YFP-MASP1 (unmutated, expressed in the Col-0 wild-type background) transgenic plants compared with the Col-0 wild type in control or soil drying treatments (mean ± se, n = 6 to 8, *P ≤ 0.05 by one-sided t test). For the Col-0 wild type, rosette fresh weight and dry weight were nearly 70% lower in the soil drying treatment relative to the well-watered control. The soil drying experiments and presentation of data are the same as described in Figures 1E and 1F.
(E) Representative rosettes of the wild type and Pro35S:YFP-MASP1 (unmutated, expressed in the Col-0 wild-type background) in the unstressed control and soil drying treatments. Bars = 1 cm.
(F) Areas of epidermal pavement cells of leaf 6 in Col wild type and Pro35S:YFP-MASP1 in control and soil drying treatments. Open boxes with green median lines show data for the unstressed control and gray boxes with red median lines are stress treatment (black lines in each box indicate the mean, while box and whiskers indicate the 25 to 75 and 5 to 95 percentile ranges, respectively, and black circles show outlying data points). Data are means ± se (n = 40 to 80) combined from four to six plants. Lowercase letters above each box indicate significantly different groups (ANOVA on ranks, P ≤ 0.05; Supplemental Data Set 12).
(G) Representative scanning electron microscopy images with example epidermal pavement cells outlined in orange to illustrate the increased size, but normal morphology, of Pro35S:YFP-MASP1 cells. Bars = 50 μm.
(H) Transgenic plants with stable expression of Pro35S:YFP-EGR1, EGR2, or MASP1 were incubated with FM4-64 to test for colocalization with the plasma membrane. Cells in the root elongation zone are shown. Yellow boxes in the merged images show the area that is enlarged in (I). Bars = 10 μm
(I) Enlargement of the yellow boxed areas in (H). Bars = 1 μm.

