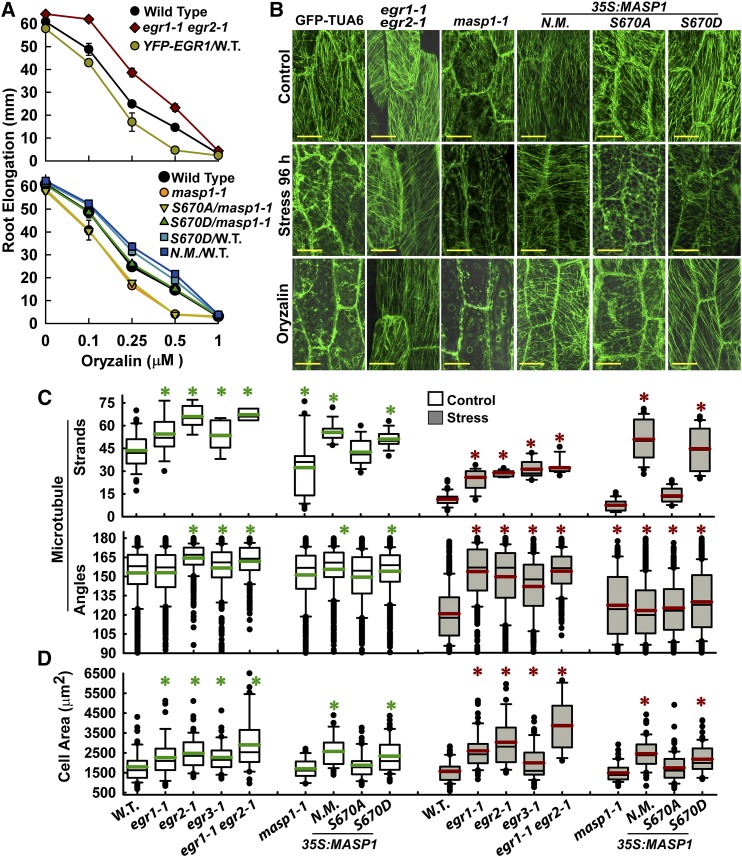
Figure 4.
egr Mutants and Plants Expressing MASP1 or Phosphomimic MASP1 Exhibit Enhanced Recovery of MT Organization at Low ψw and Also Have Increased Cell Size.
(A) Sensitivity of root elongation to various concentrations of oryzalin in egr1-1 egr2-1 and masp1 mutants as well as unmutated MASP1 (N.M.), MASP1 S670D (phosphomimic), and MASP1S670A (phosphonull) transformed into Col-0 wild type (W.T.) or masp1-1 (transgenic lines are the same as those shown in Figures 1 and 3). Four-day-old seedlings were transferred to plates containing the indicated oryzalin concentrations, and root elongation was measured over the subsequent 7 d. Data are means ± se, n = 6 to 25. All mutants or transgenic lines except for MASP1S670D/masp1-1 were significantly different from the wild type (P ≤ 0.05 by t test) in the 0.25 and 0.5 μM oryzalin treatments.
(B) Representative images of MT organization in hypocotyl cells at the base of the elongation zone visualized using GFP fused to Arabidopsis α-Tubulin6 (GFP-TUA6). Eleven-day-old seedlings were used for imaging. Stress = −1.2 MPa, 96 h. Oryzalin = 10 μM for 45 min. Bars = 20 μm.
(C) Quantification of microtubule strands per cell and microtubule angle distribution. Data are mean ± se, n = 10 to 50 for microtubule strands, n = 100 to 300 for angles, and asterisk indicates P ≤ 0.05 (by t test) compared with GFP-TUA6. Black lines in the boxes are the mean, and green or red lines are the median. Box and whiskers indicate the 25 to 75 and 5 to 95 percentile ranges, respectively, while black circles are outliers.
(D) Cell area of hypocotyl cells analyzed in (C). Data are means ± se, n = 20 to 60, asterisk indicates P ≤ 0.05 (by t test) compared with GFP-TUA6 (W.T.). The graph is formatted the same as in (C).

