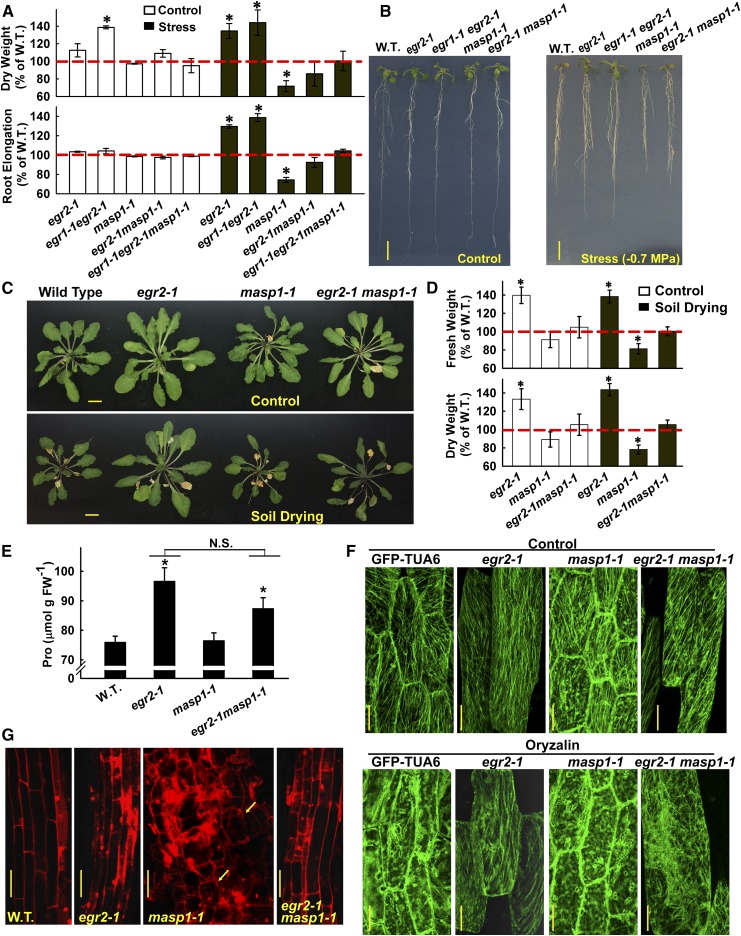
Figure 5.
MASP1 Is Epistatic to EGRs in Growth but Not Proline Accumulation.
(A) Analysis of dry weight (D.W.) and root elongation for seedlings under control and stress (−0.7 MPa) conditions for egr2-1, egr1-1 egr2-1, masp1-1, and egr2-1 masp1-1. Data are relative to the Col-0 wild type (W.T.; mean ± se, n = 6 to 8, asterisk indicates significant difference compared with the wild type by one-sided t test [P ≤ 0.05]) and are combined from two independent experiments. Typical growth values of Col-0 wild type used for normalization are shown in Supplemental Figure 2.
(B) Representative seedlings in the unstressed control (7 d after transfer) and at low ψw (−0.7 MPa, 10 d after transfer). Bars = 1 cm.
(C) Representative rosettes of Col-0 wild type, egr2-1, masp1-1, and egr2-1 masp1-1 in the unstressed control and soil drying treatments. The soil drying experiments and presentation of data are the same as described in Figures 1E and 1F. Bars = 1 cm.
(D) Relative rosette fresh weight and dry weight of egr2-1, masp1-1, and egr2-1 masp1-1 in control or soil drying treatments. Data are means ± se, n = 4 to 8, and asterisk indicates significant difference compared with the wild type by one-sided t test (P ≤ 0.05) combined from two independent experiments.
(E) Proline accumulation after 96 h at −1.2 MPa. Data are means ± se (n = 9 to 15) combined from two independent experiments. Asterisks indicate a significant difference compared with the wild type (P ≤ 0.05). N.S., not significant.
(F) Microtubule images for hypocotyl cells of untreated seedlings and seedlings treated with 10 μM oryzalin for 45 min. Bars = 20 μm.
(G) PI staining of cells in the root elongation zone for seedlings transferred to low ψw (−0.7 MPa) for 10 d. Arrows show examples where cell swelling can be most clearly seen in masp1-1. Bars = 50 μm.

