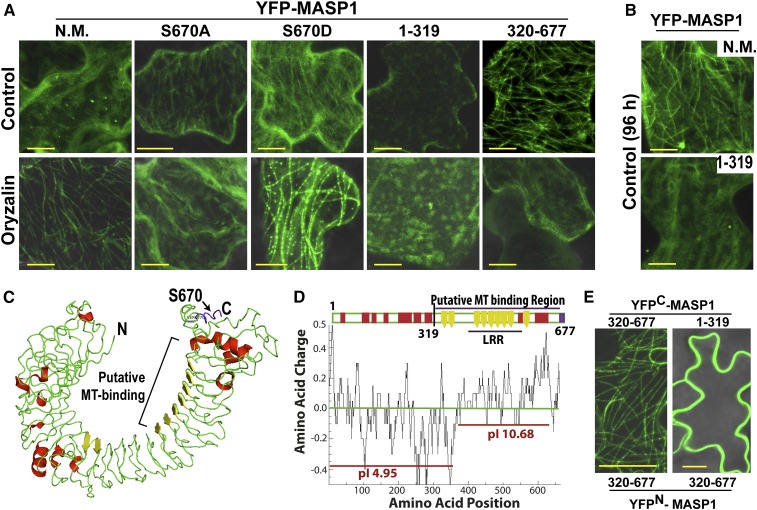
Figure 7.
MASP1 Structure and Localization Experiments Indicate That It Contains a Basic C-Terminal MT Binding Domain That Is Required and Sufficient to Decorate MTs in Planta.
(A) Localization and effect of oryzalin (10 μM) on transiently expressed YFP-MASP1 alleles and MASP1 truncations. Transient expression was done for 24 h and oryzalin treatment for 2.5 h for full-length unmutated MASP1 (N.M.), MASP1S670A (phosphonull), or MASP1S670D (phosphomimic) and 45 min for the MASP1 truncations (1 to 319 and 320 to 677). Bars = 10 μm.
(B) Transient expression of full-length MASP1 with no mutation (N.M.) and the N-terminal MASP1 fragment (amino acids 1 to 319) for 96 h. Bars = 10 μm.
(C) MASP1 structure predicted by I-Tasser (diagram generated by Pymol, nearly identical structure was predicted by Phyre2; Supplemental Figure 10A). Green = loop regions; red = helix, yellow = β-sheet. In addition, LRRsearch identified six LRR domains (Supplemental Figure 10B), which correspond to the β-sheet regions. The phosphopeptide containing Ser-670 identified in our phosphoproteomic analysis is shown in purple here and in Supplemental Figure 10B. MASP1 structure resembles typical LRR proteins, which form an α/β horseshoe fold; however, MASP1 does not have exterior helices after every turn of an interior β-sheet and thus has a less rigid secondary structure. The C-terminal β-sheet regions form a basic surface (D), which may directly contact MTs. The β-sheet LRR domains (yellow) may form multiple contact sites for lateral binding across the MTs. The internal diameter of the horseshoe structure (25 to 30 nm) is similar to the MT outer diameter (25 nm) and thus is compatible with lateral MT binding.
(D) Charge plot and pI analysis showing that the C-terminal half of MASP1, including the LRR rich region, which has basic pI consistent with direct MT binding, may be the site of direct MT binding. The charge distribution and less rigid structural fold of MASP1 (C) suggests that it binds the microtubule surface in a flexible manner leaving the two ends of the protein free for additional interactions. Charge plot was drawn using Emboss explorer (http://www.bioinformatics.nl/cgi-bin/emboss/charge) with a window size of 10 amino acids and pI of different sections of MASP1 calculated using the Compute pI/Mw tool (http://web.expasy.org/cgi-bin/compute_pi/pi_tool).
(E) BiFC assays of MASP1 C-terminal (320 to 677) and N-terminal (1 to 319) fragments. Bars = 20 μm.

