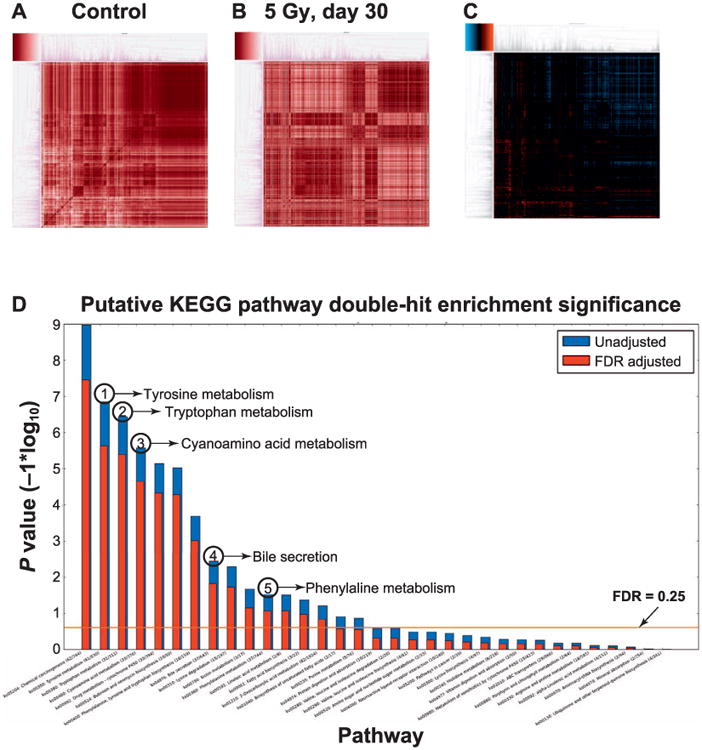
Fig. 2.

Differential correlation analysis showed shifts in the coregulation of several key pathways. Panel A: Dissimilarity heatmap generated from the Pearson's correlation coefficients calculated for the control group exhibiting a high degree of coregulation and coordination, as represented by the abundance of dark red hues. Panel B: Dissimilarity heatmap generated from the Pearson's correlation coefficients calculated for mice exposed to 5 Gy (30-day time point) showing a clear loss of correlation compared to panel A, as exhibited by the lighter red hues in the periphery of the top right corner where darker hues existed in the previous heatmap. There is also evidence of increased coregulation as a result of radiation exposure, as exhibited by the newly darkened areas in the bottom left corner when compared to panel A. These differences are emphasized in the differential correlation heatmap in panel C, where orange hues represent a gain of correlation (and thus increased coregulation), while blue hues represent a loss of correlation (i.e. dysregulation). Panel D: The results of “double hit” pathway enrichment analysis on this subset of correlation shifts. The y-axis is the −1*log10 (P value) for each KEGG pathway, as calculated by the uncorrected (blue bar) and FDR corrected (red bar) hypergeometric test. Several pathways are highlighted based on their statistical and biological significance including tyrosine metabolism, tryptophan metabolism, cyanoamino acid metabolism, bile acid secretion and phenylalanine metabolism all undergoing increased coregulatory activity.
