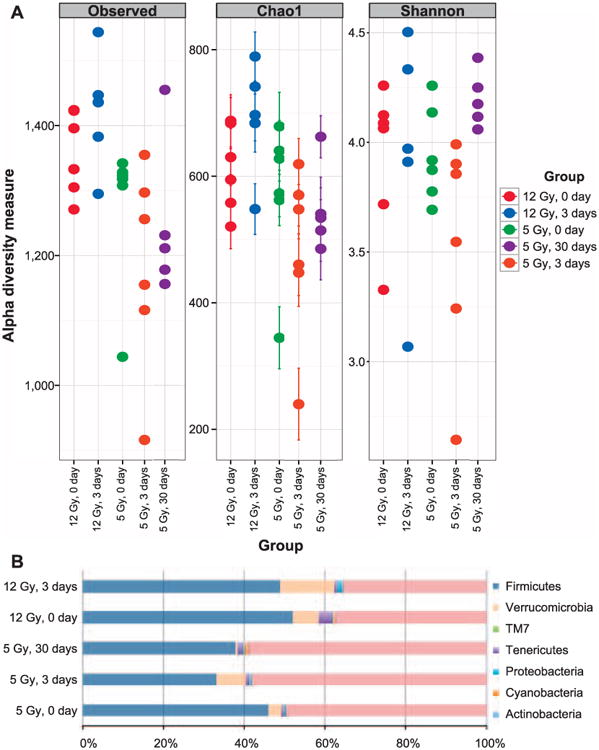
Fig. 5.

Microbiome diversity analysis of fecal samples of pre- and postirradiation. (panel A) Alpha diversity measures of fecal microbiome, observed richness, Chao1 measure and Shannon index are shown. In this plot each closed circle represents an individual mouse. The “0 day” denotes preirradiation (panel B). Proportion of OTUs present in mouse feces classified at the phylum level.
