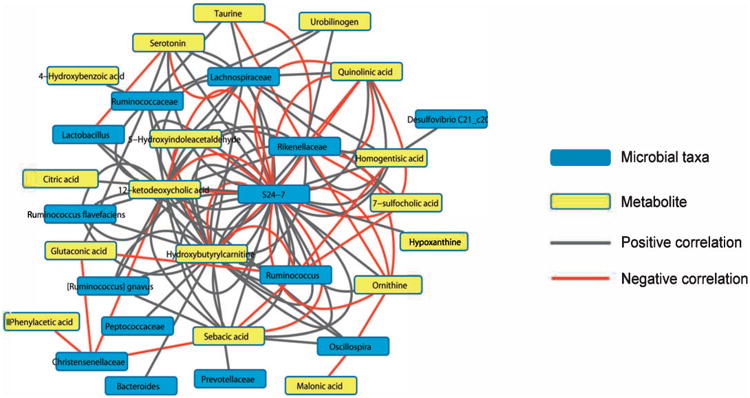
Fig. 7.

Inter-omic network between metabolites and microbes. The network was created from correlations between 20 validated metabolites and OTUs with differential abundance after irradiation that were identified at the family to species level. These correlations were based on the residuals of fitted models to account for radiation status. The metabolites are in yellow and the taxa in blue, with red lines showing negative correlation and gray showing positive correlation. Each line represents a correlation between a single OTU within the taxa and a validated metabolite.
