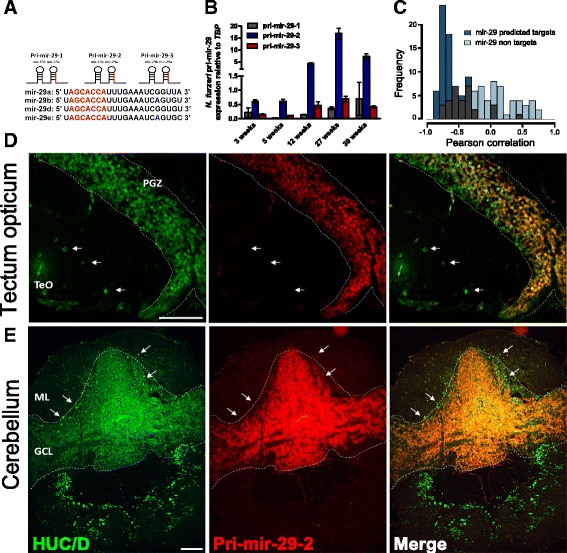
Fig. 1.

MiR-29 is up-regulated with age in neurons. a Genomic organization of miR-29 family in N. furzeri. Three different clusters were isolated (pri-mir-29 1, 2, 3) encoding four different mature members miR-29a, b, d, e. In red, seed sequence is reported, single nucleotide differences in blue. b Age-dependent expression of miR-29 primary transcripts (Pri-miR-29-1, 2, 3) in the brain of N. furzeri. The relative expression was evaluated by RT-qPCR, data were normalized on TATA binding protein (TBP), pri-miR-29-2 results much more expressed than the other clusters and shows a clear age-dependent up-regulation (1 way ANOVA with post-test for trend: R = 0.5285 P < 0.0001, n = 4 animals for age group). c Correlation of miR-29 with its predicted targets. Blue bars show the distribution of Pearson’s correlation coefficients between miR-29a and its predicted target. Light-blue bars show the distribution of correlation values extracted from a bootstrap (P = 10–14, Kolmogorov–Smirnoff). d, e Pri-miR-29-2 expression pattern in N. furzeri brain. d Pri-miR-29-2 signal (red) and HuC/D expression (green) in the optic tectum (TeO). Pri-miR-29-2 shows a nuclear staining and a co-localization with neuronal marker HuC/D along the periventricular gray zone (PGZ), white arrows show neurons in the optic tectum (TeO) negative for pri-miR-29-2. Scale bar = 50 μm. Cerebellum overview picture (e) shows a clear and strong expression of pri-miR-29-2 just in the granular cell layer (GCL), it is instead absent in the Purkinje cell (white arrow) and molecular layer (ML). Scale bar 100 μm
