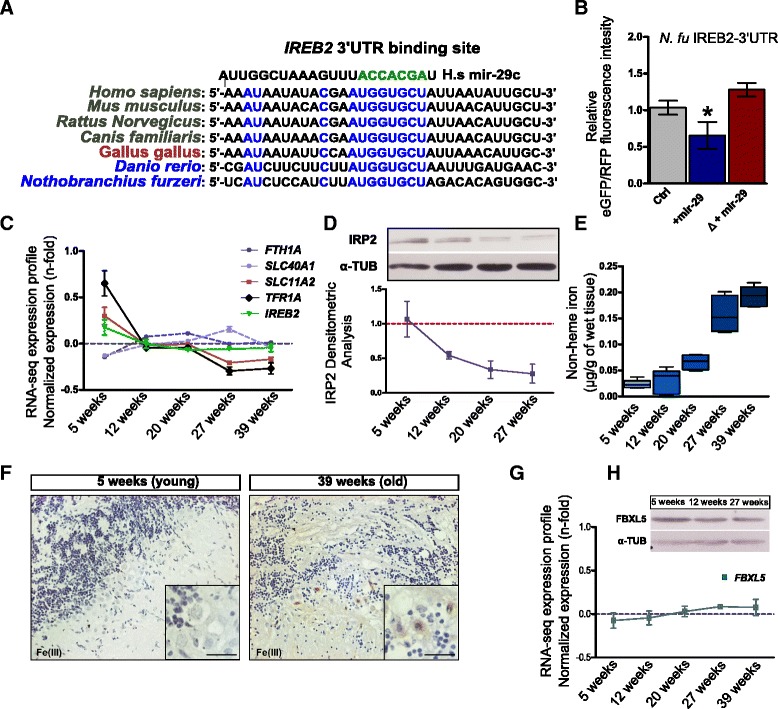
Fig. 4.

MiR-29 family targets Ireb2 mRNA. a Presence of a putative binding site for miR-29 family in the Ireb2 mRNA 3′-UTR sequence in several vertebrate species (H. sapiens: ENSG00000136381; M. musculus: ENSMUSG00000032293; R. norvegicus: ENSRNOG00000013271; C. familiaris: ENSCAFG00000001766; G. gallus: ENSGALG00000003171; D. rerio: ENSDARG00000021466; N. furzeri: Nofu_GRZ_cDNA_3_0193494), mammalian sequences are in black, birds in purple, and teleost fish in blue. Perfect match to positions 2–8 of the miR-29 seed sequence is highlighted in green and is present in all vertebrate sequences shown. b Expression of GFP assessed by cytofluorometric analysis. Fusion with Ireb2 3′-UTR of N. furzeri. The gray column reports the baseline fluorescence intensity of the construct without miR-29 mimic. The middle blue column reports the fluorescence with miR-29 mimic and the red column the fluorescence of a construct (Δ) where the putative binding site for miR-29 in the Ireb2 3′-UTR was mutated to destroy complementarity. Statistical significance of fluorescence difference between baseline and co-injection with miR-29 mimics was evaluated by Student’s t-test (* P < 0.05). c Age-dependent regulation of transcripts coding for key genes of iron metabolism, from Baumgart et al. [46]. One-way ANOVA for linear trend is reported for each gene: Tfr1a (R = 0.5009; P < 0.0001), Scl11a2 (R = 0.3892; P < 0.01), Fth1a (R = 0.067; P = 0.11), Slc40a1 (R = 0.078; P = 0.11), Ireb2 (R = 0.141; P = 0.069). Expression values (in RPMKs) for each age were centered and scaled to the mean, n = 5 animals for age point. d Representative Western blot of IRP2 in brain extracts and densitometric analysis relative to Additional file 8a (Kruskal–Wallis test, P = 0.0216, n = 3 animal for each age point). α-TUBULIN was used as loading control. e Brain non-heme iron content (μg/g wet tissue) in fish of different ages. (One-way ANOVA: P < 0.0001). f DAB-enhanced Perls staining of the cerebellum of young and old fish. The black arrows point to labelled Purkinje cells. The inset in the bottom right corner of each picture shows a magnification of the Purkinje cell bodies. g, h Age-dependent expression of Fbxl5 mRNA (ANOVA for linear trend: R = 0.1922, P = 0.0688) and western blot of FBXL5 in brain lysates at three age points (5, 12, and 27 weeks). α-TUB was used as loading control. For b, c, d, e, g mean ± standard errors of means is reported
