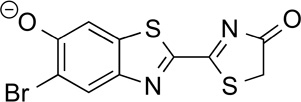
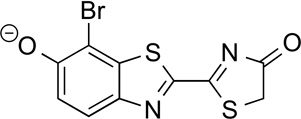
Table 1.
Comparison of calculated oscillator strengths and bioluminescence emission intensities.
| Compound | Name | Oscillator Strengtha |
Rel. BLIb |
|---|---|---|---|
 |
D–Luc | 100 | 100 |
 |
6'–deoxyLuc | 1.4 | <0.01c |
 |
6'–methoxyLuc | 57.2 | <0.01 |
 |
6'–aminoLuc 6'–MeNHLH2 6'–Me2NLH2 |
91.9 94.9 102.9 |
61 101 1 |
 |
CycLuc1 | 127.6 | 38 |
 |
4'–BrLuc | 86.1 | 3.1 |
 |
5'–BrLuc | 104 | 46.0 |
 |
7'–BrLuc | 79.3 | 3.4 |
Calculated as a theoretical maximum.
Bioluminescence was measured using 100 µM luciferin and 1 µg Fluc.
No signal observed.
