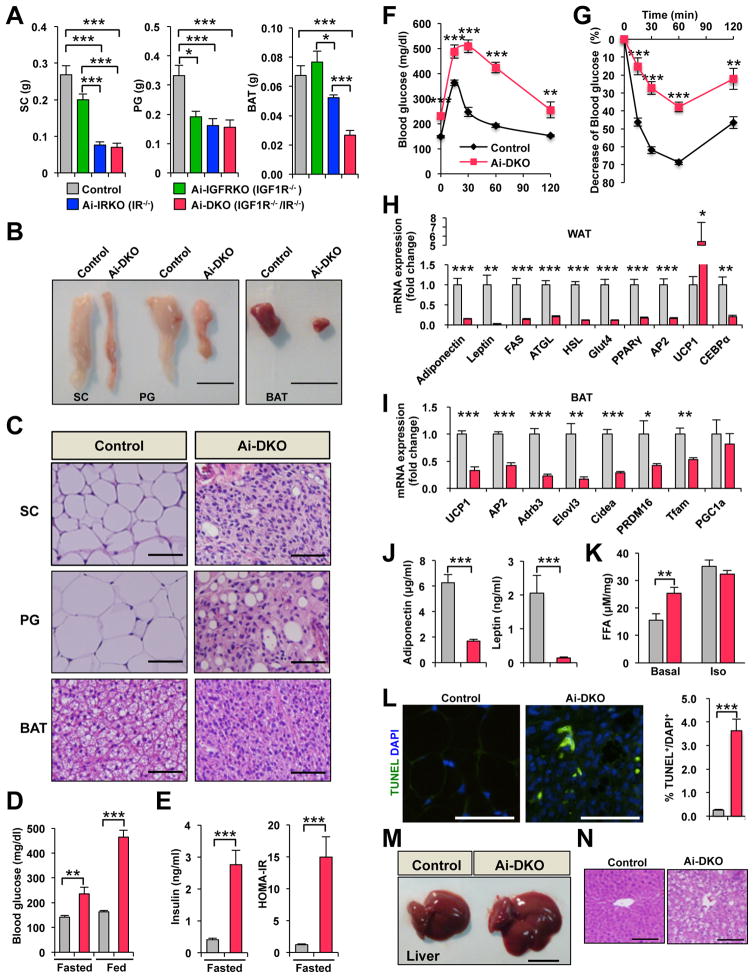
Figure 1.
Physiology of mice with acute disruption of IR and/or IGF1R in fat. All data are from male mice 7–8 weeks of age on normal chow diet. Day 0 is the day of the last tamoxifen dose. (A) Tissue weights of SC-WAT, PG-WAT, and BAT in Control (n = 13), Ai-IGFRKO (IGF1R−/−) (n = 6), Ai-IRKO (IR−/−) (n = 13) and Ai-DKO (IGF1R−/− IR−/−) (n = 12) day 3 after treatment with tamoxifen. (B) Representative pictures of adipose tissue of Control and Ai-DKO at day 3. Scale bars indicate 1 cm. (C) HE stained sections of adipose tissue at day 3. Scale bars, 50 μm. (D) Blood glucose levels of Control (n = 13) and Ai-DKO (n = 14) under fed and fasted conditions at day 2. (E) Serum insulin and HOMA-IR levels of Control (n = 13) and Ai-DKO (n = 14) under fasting conditions at day 2. (F) OGTT on day 2 for Control (n = 13) and Ai-DKO (n = 12). (G) ITT on day 2 (n = 10/genotype) (H) mRNA expression measured by real-time qPCR in SC-WAT from Control (n = 7) and Ai-DKO (n = 6) at day 3. (I) mRNA abundance measured by real-time qPCR in BAT from Control (n = 7) and Ai-DKO (n = 6) at day 3. (J) Serum adiponectin and leptin concentrations at day 2 (n = 5/genotype). (K) Lipolysis assessed by FFA release from SC-WAT of Control (n = 5) and Ai-DKO (n = 7) at day 1.5. Samples were incubated ex vivo for 2 h at 37 °C in the presence or absence of 10 μM isoprenaline, and FFA released into the medium was quantified. (L) SC-WAT sections from Control and Ai-DKO were stained for TUNEL and DAPI at day 3 (left) and quantitated (n = 6/genotype) (right). (M) Representative pictures of liver in Control and Ai-DKO at day 3. Scale bar indicates 1 cm. (N) Liver tissue sections stained with HE in Control and Ai-DKO at day 3. Scale bars, 100 μm. Statistical significance is shown as p<0.05 (*), p<0.01 (**), and p<0.001 (***).

