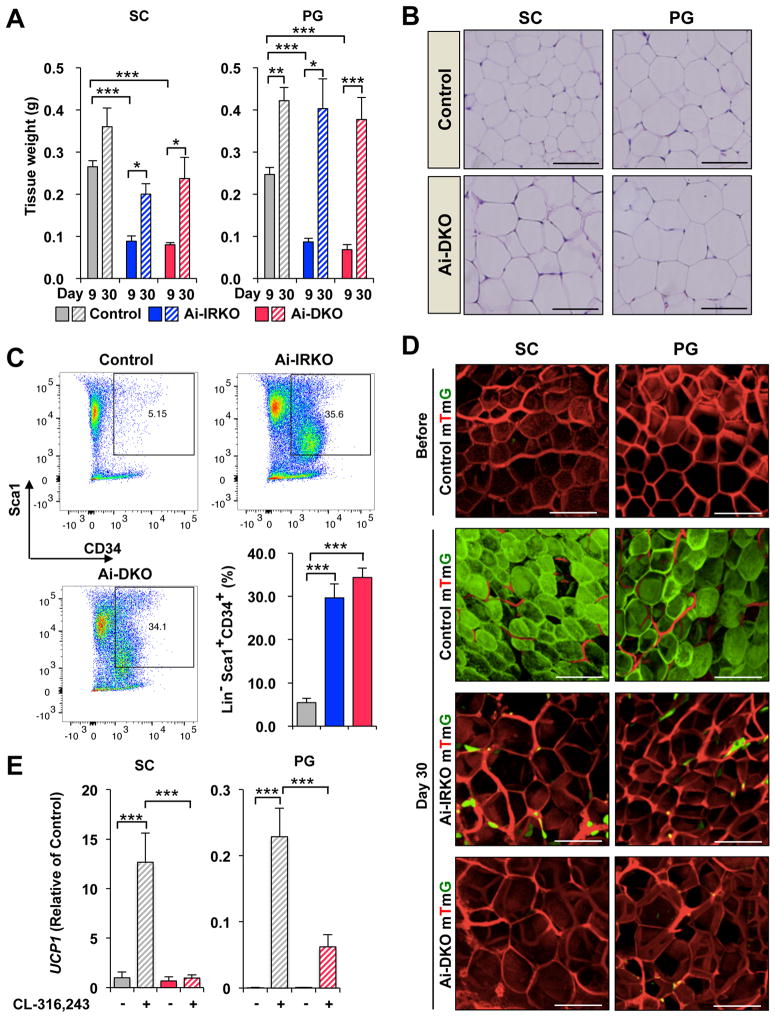
Figure 4.
Regeneration of WAT in Ai-IRKO and Ai-DKO. (A) Recovery of tissue weights of SC and PG-WAT in Ai-IRKO (n = 6–7) and Ai-DKO (n = 6) at day 9 to 30 after tamoxifen-treatment compared to Control (n = 6). (B) SC and PG-WAT sections with HE in Control and Ai-DKO at day 30. Scale bars, 50 μm. (C) FACS profiles of sorted subcutaneous adipose SVF at day 3 from Control (n = 11), Ai-IRKO (n = 9) and Ai-DKO (n = 6). The live cells of the lineage-negative (Lin−) population, i.e. lacking of CD31, CD45 and Ter119 expression, were considered preadipocyte on the basis of positive Sca1 and CD34 expression. Representative data are indicated as the FACS profiles, and the averages are shown in the right graph. (D) mTmG labeling of mature SC and PG adipocytes in Control, Ai-IRKO and Ai-DKO before and on day 30 after tamoxifen treatment. Scale bars, 100 μm. (E) qPCR of Ucp1 gene expression in SC (left) and PG-WAT (right) from Control and Ai-DKO male mice treated with CL-316,243 (1 mg/kg) or vehicle for 7 days (n = 5–7 per group). Results are expressed as fold change over the Control SC (vehicle) group. Statistical significance is as in Figure 2.

