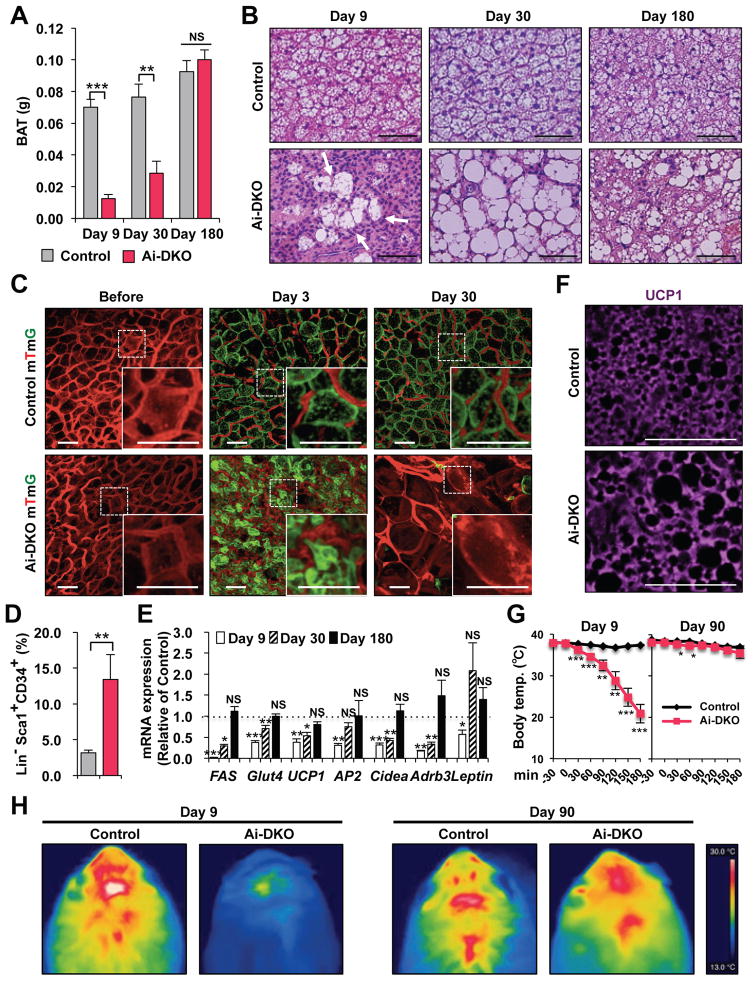
Figure 5.
Brown adipocyte regeneration in Ai-DKO. (A) Recovery of tissue weights of BAT in Ai-DKO (n = 5–6) male mice at day 9, 30, and 180 after tamoxifen-treatment compared to Control (n=6–8). (B) H & E staining of BAT sections on day 9, 30 and 180. Scale bars, 50 μm. (C) mTmG lineage tracing of brown adipocytes in BAT of Control and Ai-DKO also carrying a Rosa- mTmG transgene as in Supplementary Figure 3C before and on days 3 and 30 after tamoxifen-treatment. Scale bars, 50 μm. (D) Percentage of Sca1+/CD34+ preadipocytes cells in brown adipose (Lin−) SVF at day 3 in Control (n = 10) and Ai-DKO (n = 6). (E) Relative mRNA levels in Ai-DKO (n=5–6) and Control (n = 6–7) on days 9, 30 and 180 after tamoxifen-treatment. (F) UCP1 expression in BAT assessed by anti-UCP1 immunostaining in Control and Ai-DKO at day 180. (G) Rectal temperature in Control and Ai-DKO at day 9 and 90 during a 3 h exposure to an 8 °C environment (n = 5 per group). (H) Thermal images using a FLIR T300 Infrared Camera showing surface temperature over interscapular BAT after 2 h at 8 °C between Control and Ai-DKO on day 9 and 90. Statistical significance is as in Figure 2

