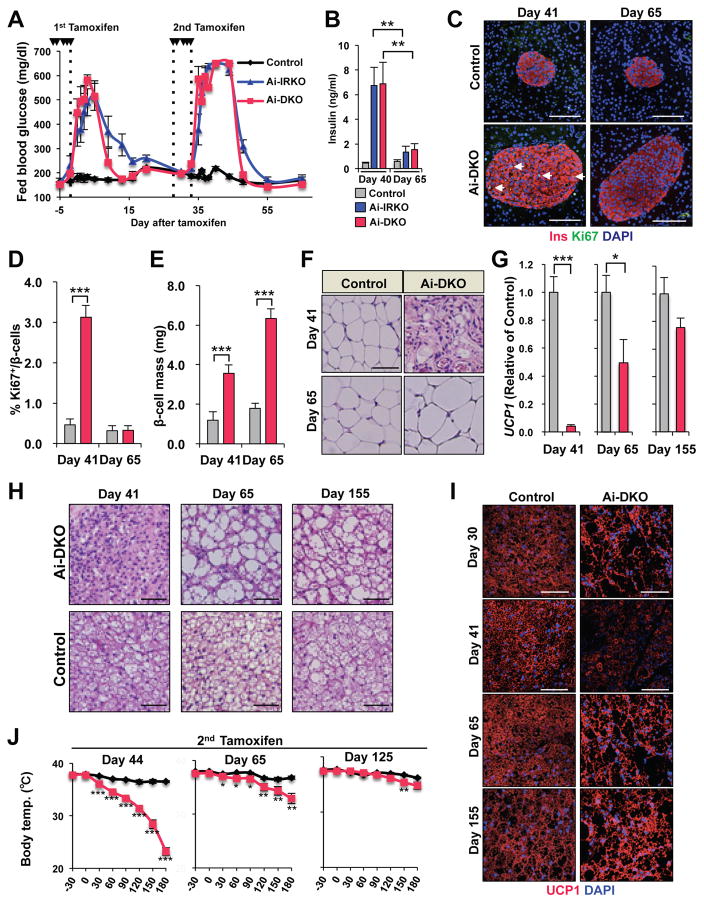
Figure 6.
Regeneration potential of WAT and BAT after two rounds of tamoxifen-treatment, with the second round given 5 times over 6 days between days 30 and 35. (A) Fed blood glucose levels after 1st and 2nd rounds of tamoxifen in Control (n = 9), Ai-IRKO (n = 6) and Ai-DKO (n = 5). (B) Serum insulin was measured in Ai-IRKO and Ai-DKO at days 40 and 65 compared with Control (n = 5–7 per group). p<0.05 = ** and p<0.001 = ***. (C) Pancreatic sections from Control and Ai-DKO were stained for insulin and Ki67 at days 41 and 65 after tamoxifen treatment. Scale bars, 100 μm. (D) Quantitation of Ki67+insulin+ cells in Control (n = 5–7) and Ai-DKO (n = 5–7) pancreas at days 41 and 65 after tamoxifen-treatment. (E) Quantitation of β-cell mass in Control (n = 4–7) and Ai-DKO (n = 4–7) pancreases at days 41 and 65. (F) HE sections of SC-WAT from Control and Ai-DKO mice at days 41 and 65. Scale bars, 50 μm. (G) Relative UCP1 mRNA levels in Ai-DKO (n = 4–6) and Controls (n = 4–10) at day 41, 65 and 155. (H) HE sections of BAT from Control and Ai-DKO at days 41, 65 and 155. Scale bars, 50 μm. (I) UCP1 expression in BAT by anti-UCP1 immunostaining in Control and Ai-DKO at days 30, 41, 65 and 155. Scale bars, 50 μm. (J) Rectal temperature in male Control and Ai-DKO taken every 30 min for 3 h during exposure to an 8 °C environment (n = 5 per group) at days 44, 65 and 125. Comparison of rectal temperature drop after 3 h of 4 °C challenge in Control and Ai-DKO (right). Statistical significance is as in Figure 2..

