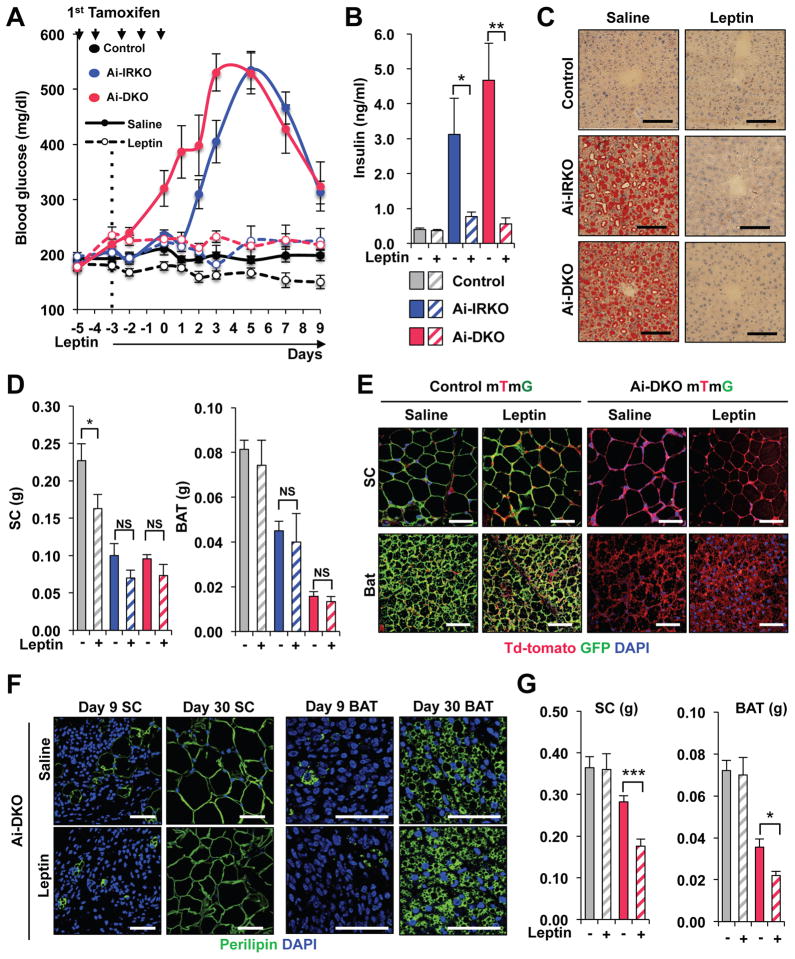
Figure 7. Leptin inhibits the hyperglycemia and hepatic steatosis but not the regeneration of white and brown adipocytes in Ai-DKO.
(A) Effect of leptin treatment on hyperglycemia induced by gene recombination in Ai-IRKO and Ai-DKO compared to Controls (n = 5–7 per group). Leptin (10 mg/day) was administered using Alzet 1002 minipumps between day −3 and day 9 surrounding tamoxifen-treatment. (B) Fasted serum insulin concentrations at day 3 after tamoxifen-treatment with or without leptin (n = 5–7 per group). (C) Liver sections stained with Oil Red O for Control, Ai-IRKO and Ai-DKO with saline or leptin at day 3. Scale bars, 100 μm. (D) Weights of SC and BAT fat at day 9 in Ai-IRKO (Saline: n=6, leptin: n=5), Ai-DKO (Saline: n = 7, leptin: n = 6) and Control (Saline: n = 9, leptin: n = 7). (E) Immunofluorescence staining for GFP (green), Td-tomato (red) and DAPI (blue) in SC-WAT and BAT from Control mTmG and Ai-DKO mTmG, as indicated, at day 30. Scale bars, 50 μm. (F) Perilipin (green) staining of SC and BAT in Ai-DKO (with saline or leptin) at day 9 and 30. Scale bars, 50 μm. (G) Tissue weights of SC and BAT at day 30 in Ai-DKO (Saline: n = 9, leptin: n = 5) and Control (Saline: n = 9, leptin: n = 5). Statistical significance is as in Figure 2.

