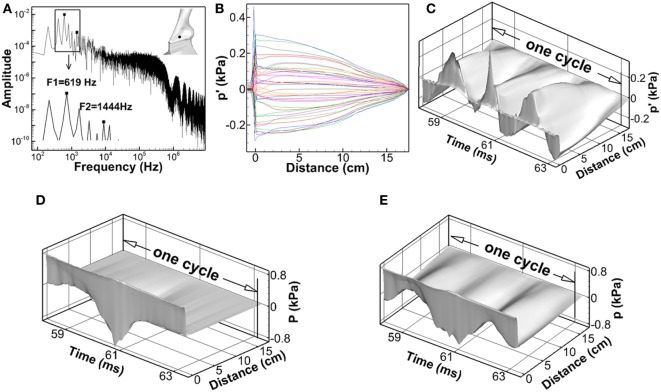
Figure 3.
(A) Frequency spectrum of the acoustic perturbation pressure (p′) at the point of Y = 4.0 cm, Z = 3.2 cm, which was at the mid-coronal plane, and 0.1 cm above the vocal fold superior surface, indicated by the black dot in the inlaid graph. (B) Acoustic perturbation pressure (p′) along the centerline of the vocal tract at different time instants during one vibration cycle. (C–E) The time–spatial variation of acoustic perturbation pressure (p′), incompressible pressure (P), and total pressure (p) along the centerline of the vocal tract.

