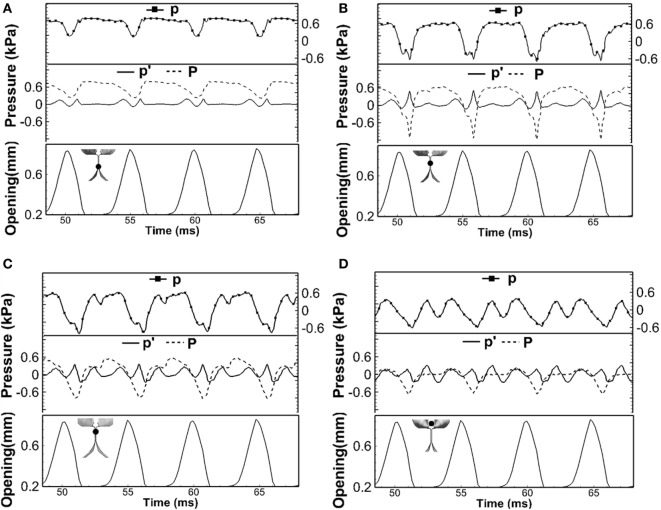
Figure 4.
The time variation of the total pressure (p), acoustic perturbation pressure (p′), and incompressible pressure (P) at four different locations: (A) Y = 3.6 cm, (B) Y = 3.7 cm, (C) Y = 3.8 cm, and (D) Y = 4.0 cm. The locations of the points are indicated by the black dot in the inlaid graph. The variation of glottal opening is also plotted in the lower part of each subfigure.

