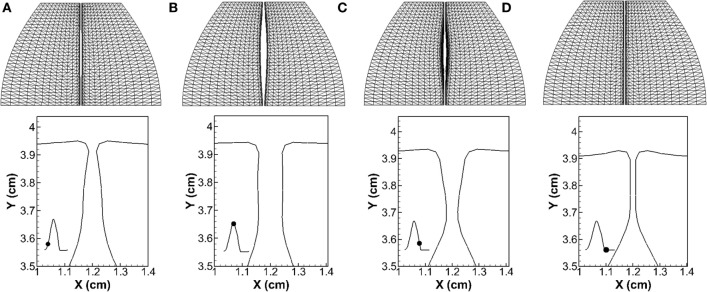
Figure 5.
Vocal fold vibration pattern at four time instants during one vibration cycle. The first row shows the top view of the vocal folds, and the second row shows the profile of the vocal folds at the mid-coronal plane. The waveform of the opening size of the glottis is shown in the inlaid graph with the black dot superimposed indicating the time instant. (A) T = 58.7 ms, (B) T = 59.8 ms, (C) T = 60.9 ms, and (D) T = 61.8 ms.

