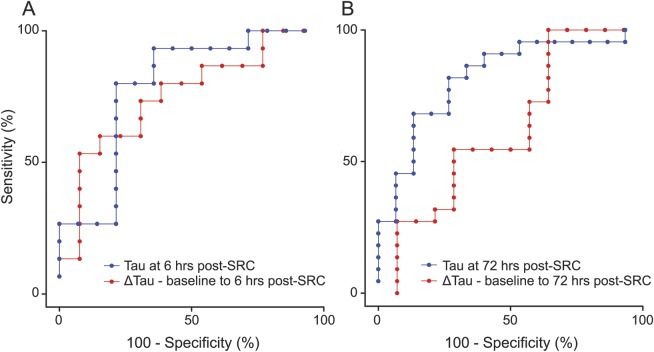
Figure 3. Accuracy of plasma tau for predicting return to play (RTP) 6 hours and 72 hours after sports-related concussion (SRC).
(A) Blue curve represents the receiver operating characteristic (ROC) of plasma tau measured 6 hours after SRC for predicting RTP. The area under the curve (AUC) was 0.81; 95% confidence interval (CI) 0.62–0.97, p = 0.01. The red curve represents the ROC of the participant-specific change in plasma tau from baseline to 6 hours after SRC for predicting RTP. AUC was 0.80; 95% CI 0.57–0.94, p = 0.02. (B) Blue curve represents the ROC of plasma tau measured 72 hours after SRC for predicting RTP. The AUC was 0.82; 95% CI 0.68–0.96, p < 0.01. The red curve represents the ROC of the participant-specific change in plasma tau from baseline to 72 hours after SRC for predicting RTP. AUC was 0.74; 95% CI 0.58–0.90, p = 0.20.

